개요
이 전략은 인공지능 기술을 결합한 고급 트렌드 추적 거래 시스템으로, 주로 VPS (변동 가격 시스템) 기하급수와 WOW 트렌드 방법을 통합한다. 시장의 변동성과 트렌드 강도를 식별하기 위해 VPS를 사용하며, 잠재적인 가격 반전 지점을 탐지하기 위해 RSI 기하급수와 결합한다. 이 전략은 다중 공중 쌍방향 거래에 대한 정확한 입문 신호를 제공하며, 동시 트렌드 동력과 기하급수 분석을 사용하여 시장 예측의 정확성을 강화한다.
전략 원칙
이 전략은 세 가지 핵심 요소를 기반으로 작동합니다.
- WOW 트렌드 지표는 트렌드 변화를 확인하기 위해 사용된다.
- VPS 조건은 변동성과 트렌드 강도를 검증하는 데 사용됩니다.
- RSI 탈피 분석은 잠재적인 전환점을 식별하는 데 사용됩니다.
시스템은 먼저 ATR 기반의 동적 지원 및 저항 통로를 계산하여 VPS 길이 변수 (기본 11) 와 결합하여 시장 상태를 평가합니다. 가격이 초매 수준 (기본 78) 또는 초매 수준 (기본 27) 을 돌파하면 거래 신호를 유발합니다. 동시에, 전략은 가격과 VPS 지표 사이의 오차를 모니터링하여 거래 방향을 추가로 확인합니다.
전략적 이점
- 다차원 분석: 트렌드 추적, 변동률 및 변동 분석을 결합하여 더 포괄적인 시장 관점을 제공합니다.
- 자기 적응성: 동적인 ATR 채널을 사용하여 시장의 변동성에 따라 자동으로 조정할 수 있습니다.
- 리스크 관리가 완벽합니다: 내장된 스톱 스톱 손실 메커니즘으로, 미리 설정된 수익 목표에 따라 자동으로 청산 할 수 있습니다.
- 신호 확인 메커니즘: 트레이드를 트리거하기 위해 여러 조건이 동시에 충족되어야 함으로써 가짜 신호의 가능성을 줄일 수 있습니다.
- 양방향 거래 능력: 시장의 변동성을 최대한 활용하여 빈 양방향 거래 기회를 잡을 수 있습니다.
전략적 위험
- 시장 소음: 가로판 또는 낮은 변동률 환경에서 잘못된 신호가 발생할 수 있습니다.
- 변수 민감성: 지표 변수의 설정 (예: VPS 길이, 초과 구매 초과 판매 수준) 은 전략 성과에 큰 영향을 미칩니다.
- 슬라이드 리스크: 짧은 주기 (예를 들어 5 분) 의 거래에서 큰 슬라이드 영향을 받을 수 있습니다.
- 신호 지연: 복수의 확인 메커니즘으로 인해 출입 시간이 상대적으로 늦어질 수 있다.
- 자금 관리: 고정 자금 배분 방식은 시장 조건에 따라 달라질 수 있습니다.
전략 최적화 방향
- 동적 변수 조정: 시장 상황에 따라 VPS 길이를 동적으로 조정하고 초과 구매 초과 판매 값을 도입할 수 있는 적응 변수 메커니즘
- 시장 환경 필터: 시장 환경 인식 모듈을 추가하여 부적절한 시장 조건에서 거래를 중지합니다.
- 스톱 로즈 최적화: ATR 기반의 더 유연한 스톱 로즈 메커니즘을 설계하여 위험 제어의 정확성을 높일 수 있습니다.
- 분기 최적화: 다른 거래 시간에 대한 특성, 전략 매개 변수 및 거래 규칙의 조정
- 자금 관리 최적화: 동적 포지션 관리를 도입하여 시장의 변동성과 적자 상황에 따라 거래 규모를 조정
요약하다
이것은 여러 가지 기술 지표와 분석 방법을 결합한 포괄적 인 거래 전략입니다. 인공 지능 기술을 전통적인 기술 분석과 결합하여 전략은 안정성을 유지하면서 높은 거래 정확도를 제공할 수 있습니다. 전략의 핵심 장점은 다층의 신호 확인 장치와 완벽한 위험 관리 시스템이며, 주요 최적화 공간은 매개 변수의 동적 조정과 시장 환경의 인식입니다. 지속적인 최적화 및 개선으로 전략은 다양한 시장 환경에서 안정적인 성능을 유지할 수 있습니다.
전략 소스 코드
/*backtest
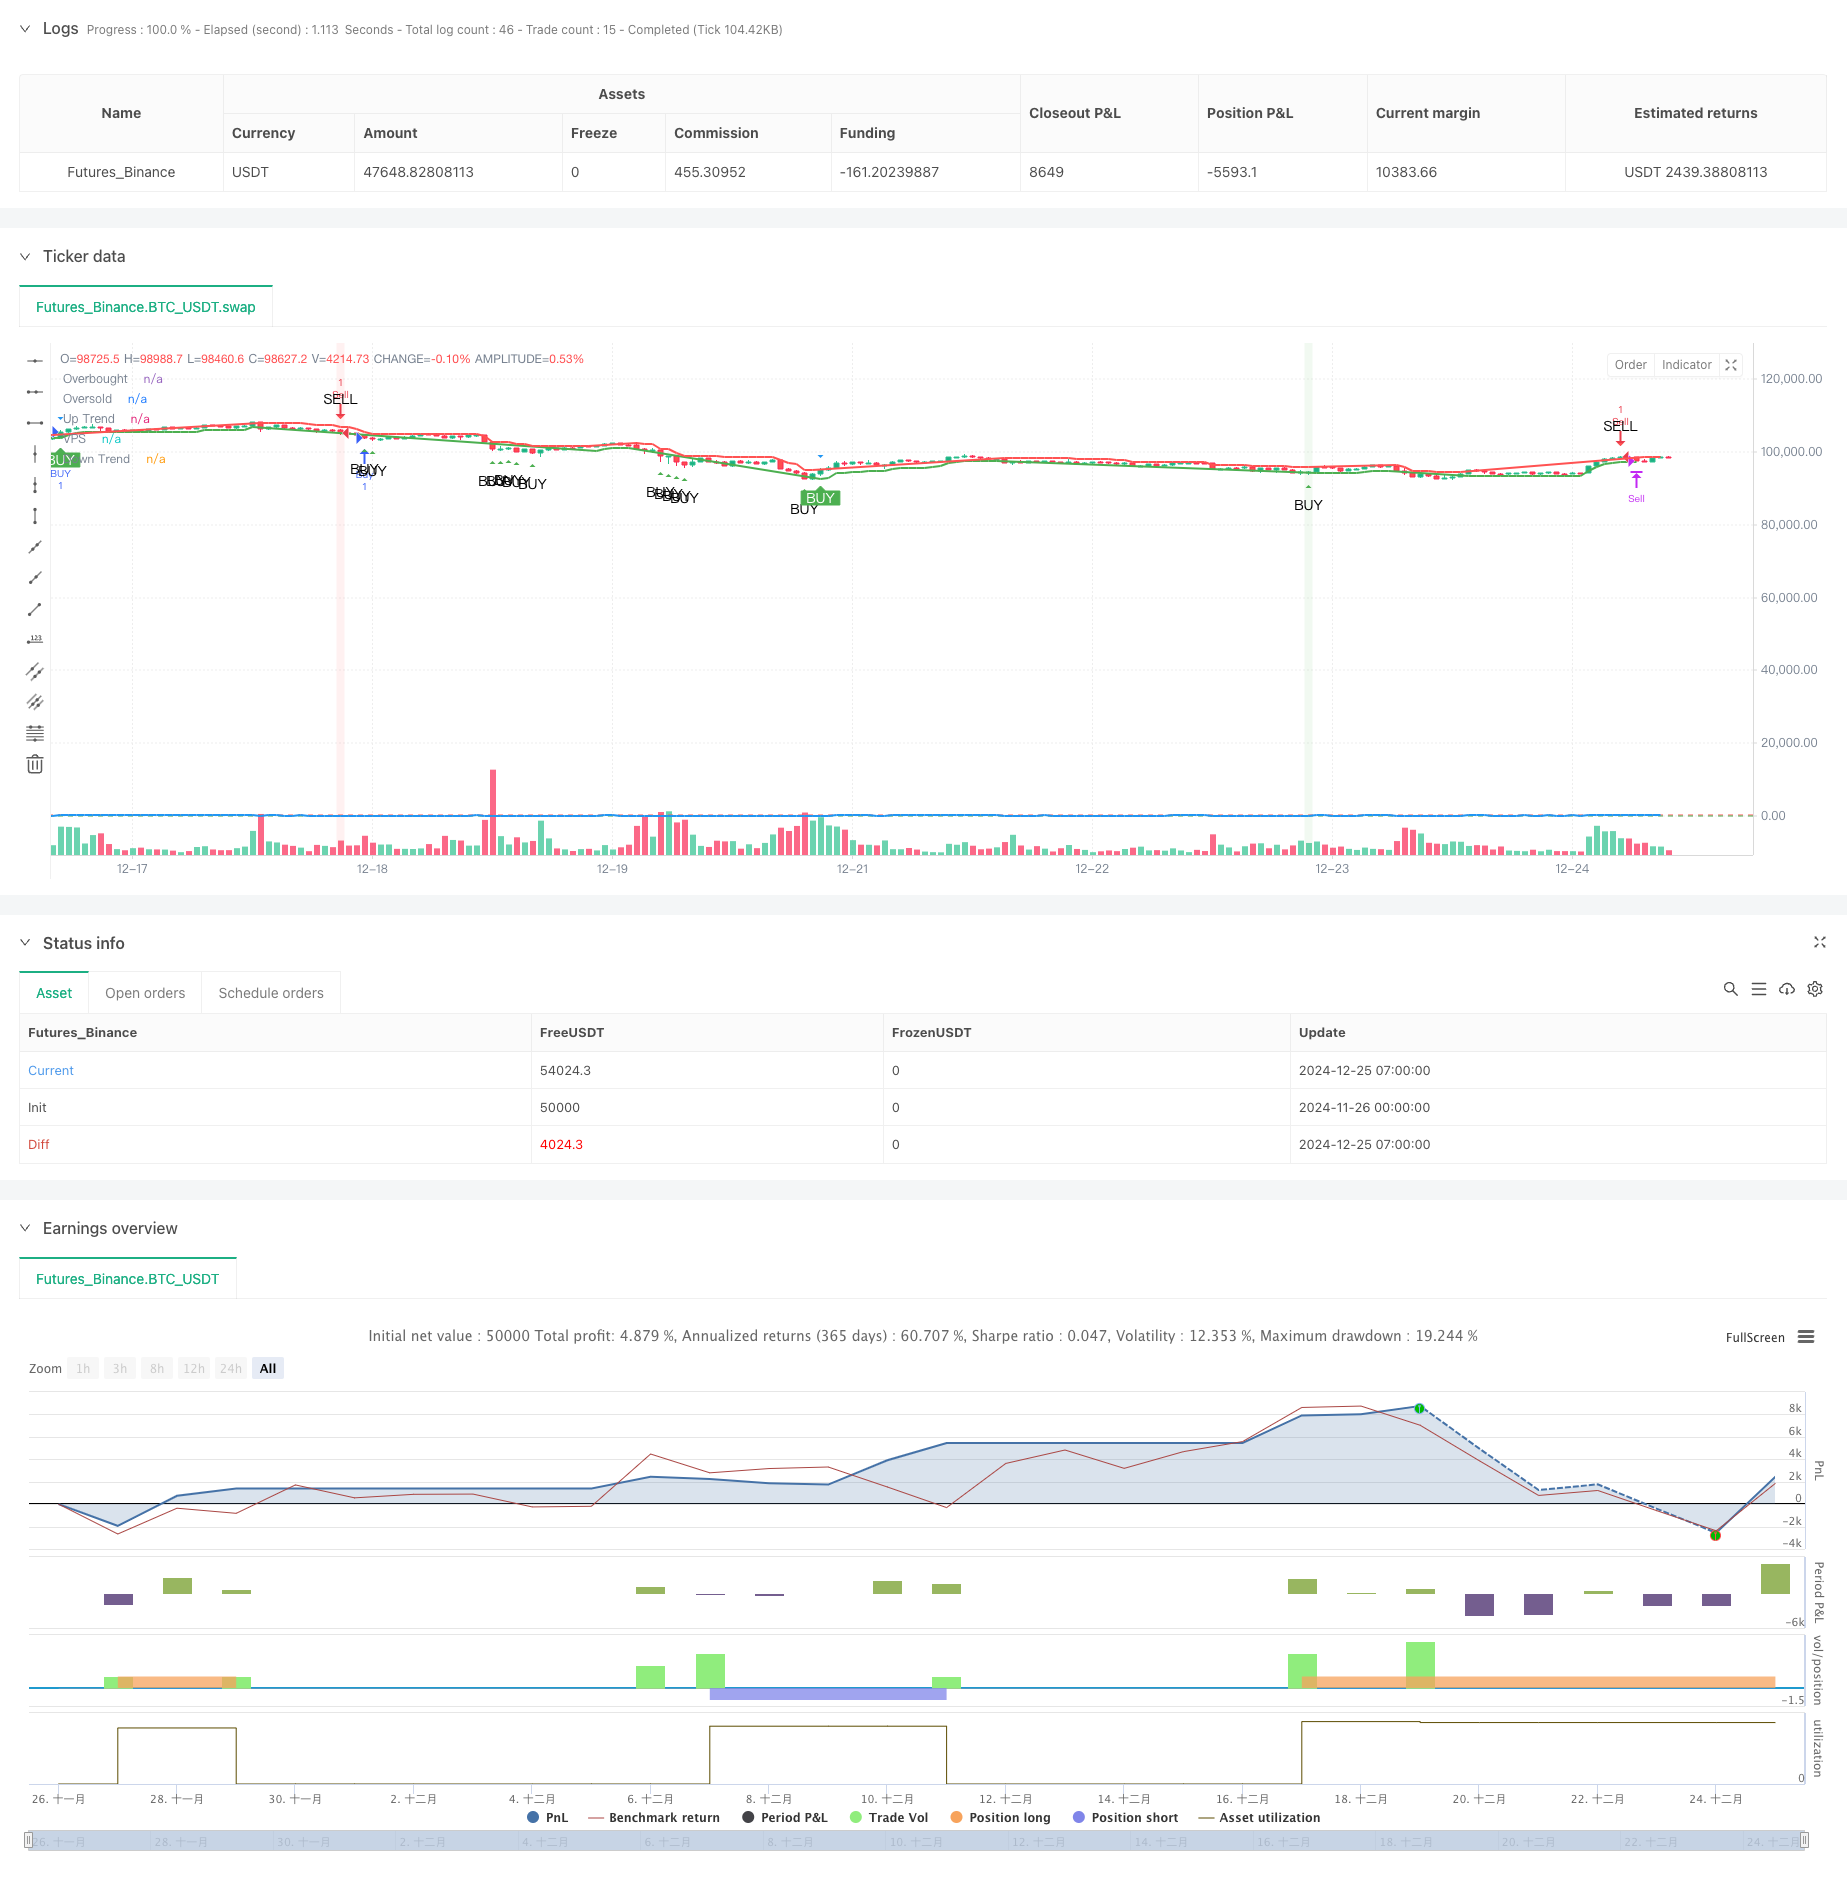
start: 2024-11-26 00:00:00
end: 2024-12-25 08:00:00
period: 1h
basePeriod: 1h
exchanges: [{"eid":"Futures_Binance","currency":"BTC_USDT"}]
*/
//@version=6
strategy("AI+VPS Vijay Prasad Strategy", overlay=true)
// --- VPS Divergence Strategy Inputs ---
vps_length = input.int(11, title="VPS Length")
vps_overbought = input.int(78, title="VPS Overbought Level") // Overbought level for VPS
vps_oversold = input.int(27, title="VPS Oversold Level") // Oversold level for VPS
// Calculate VPS (Relative Strength Index alternative) - here using a custom divergence condition
vps = ta.rsi(close, vps_length)
// Plot VPS on the chart
plot(vps, title="VPS", color=color.blue, linewidth=2)
hline(vps_overbought, "Overbought", color=color.red, linewidth=1)
hline(vps_oversold, "Oversold", color=color.green, linewidth=1)
// Define Buy and Sell Conditions based on Overbought/Oversold VPS
vps_buy_condition = vps < vps_oversold // Buy signal when VPS is oversold
vps_sell_condition = vps > vps_overbought // Sell signal when VPS is overbought
// Define Bullish and Bearish Divergence conditions
bullish_divergence = (low[1] < low[2] and vps[1] > vps[2] and low < low[1] and vps > vps[1])
bearish_divergence = (high[1] > high[2] and vps[1] < vps[2] and high > high[1] and vps < vps[1])
// Combine Buy and Sell signals:
// Buy when VPS is oversold or Bullish Divergence occurs
vps_buy_condition_final = vps_buy_condition or bullish_divergence
// Sell when VPS is overbought or Bearish Divergence occurs
vps_sell_condition_final = vps_sell_condition or bearish_divergence
// Plot Buy and Sell Signals
plotshape(series=vps_buy_condition_final, title="VPS Buy Signal", location=location.belowbar, color=color.green, style=shape.triangleup, text="BUY")
plotshape(series=vps_sell_condition_final, title="VPS Sell Signal", location=location.abovebar, color=color.red, style=shape.triangledown, text="SELL")
// VPS Divergence Highlight
bgcolor(bullish_divergence ? color.new(color.green, 90) : na) // Highlight background for Bullish Divergence
bgcolor(bearish_divergence ? color.new(color.red, 90) : na) // Highlight background for Bearish Divergence
// Strategy: Buy and Sell with target
if vps_buy_condition_final
strategy.entry("Buy", strategy.long)
if vps_sell_condition_final
strategy.entry("Sell", strategy.short)
// Capital settings for the strategy (for backtesting purposes)
capital_per_trade = input.float(1000, title="Capital per Trade (INR)", minval=1)
buy_target_inr = 1500 // Profit target for Buy in INR
sell_target_inr = 1000 // Profit target for Sell in INR
trade_value = close * (capital_per_trade / close) // Value of one contract at current price
// Profit threshold calculation
buy_profit_target = buy_target_inr / trade_value // Profit in price movement for Buy
sell_profit_target = sell_target_inr / trade_value // Profit in price movement for Sell
// Exit based on profit targets
if strategy.position_size > 0
profit_inr = (close - strategy.position_avg_price) * strategy.position_size
if profit_inr >= buy_target_inr
strategy.close("Buy", comment="Profit Target Reached")
if strategy.position_size < 0
profit_inr = (strategy.position_avg_price - close) * -strategy.position_size
if profit_inr >= sell_target_inr
strategy.close("Sell", comment="Profit Target Reached")
// --- WoW Trends + VPS (Vijay Prasad Strategy) Logic ---
Periods = input.int(title="ATR Period", defval=10)
src = input.source(close, title="Source")
Multiplier = input.float(title="ATR Multiplier", step=0.1, defval=1.7)
changeATR = input.bool(title="Change ATR Calculation Method ?", defval=true)
showsignals = input.bool(title="Show Buy/Sell Signals ?", defval=true)
// --- ATR Calculation ---
atr2 = ta.sma(ta.tr, Periods)
atr = changeATR ? ta.atr(Periods) : atr2
up = src - (Multiplier * atr)
up1 = na(up[1]) ? up : up[1]
up := close[1] > up1 ? math.max(up, up1) : up
dn = src + (Multiplier * atr)
dn1 = na(dn[1]) ? dn : dn[1]
dn := close[1] < dn1 ? math.min(dn, dn1) : dn
// --- WoW Trends Logic ---
var trend = 1
trend := na(trend[1]) ? 1 : trend
trend := trend == -1 and close > dn1 ? 1 : trend == 1 and close < up1 ? -1 : trend
// --- VPS Logic (Vijay Prasad Strategy) ---
vpsVolatilityCondition = (high - low) > (1.5 * ta.sma(ta.tr, 20)) // VPS condition based on volatility
vpsTrendCondition = trend == 1 // VPS condition to check if trend is up
vpsSignal = vpsVolatilityCondition and vpsTrendCondition // Combine both VPS conditions
// --- Buy/Sell Signal Logic ---
buySignal = trend == 1 and trend[1] == -1 // Signal to Buy (when trend switches to up)
sellSignal = trend == -1 and trend[1] == 1 // Signal to Sell (when trend switches to down)
// --- Combined Buy/Sell Signal Logic (WoW Trends + VPS) ---
combinedBuySignal = buySignal and vpsSignal
combinedSellSignal = sellSignal and vpsSignal
// --- Plot WoW Trends Lines using plot() ---
plot(trend == 1 ? up : na, title="Up Trend", color=color.green, linewidth=2)
plot(trend == -1 ? dn : na, title="Down Trend", color=color.red, linewidth=2)
// --- Plot VPS Signals ---
plotshape(vpsSignal and showsignals, title="VPS Signal", text="VPS", location=location.abovebar, style=shape.triangledown, size=size.small, color=color.blue, textcolor=color.white)
// --- Plot Combined Buy/Sell Signals ---
plotshape(combinedBuySignal and showsignals, title="Combined Buy Signal", text="BUY", location=location.belowbar, style=shape.labelup, size=size.small, color=color.green, textcolor=color.white)
plotshape(combinedSellSignal and showsignals, title="Combined Sell Signal", text="SELL", location=location.abovebar, style=shape.labeldown, size=size.small, color=color.red, textcolor=color.white)
// --- Strategy Entries ---
if (combinedBuySignal)
strategy.entry("BUY", strategy.long)
if (combinedSellSignal)
strategy.entry("SELL", strategy.short)
// --- Highlight Bars for Buy/Sell Signals ---
barcolor(combinedBuySignal ? color.green : na, offset=-1)
barcolor(combinedSellSignal ? color.red : na, offset=-1)