EMA 및 SMA 기반 다중 지표 동적 추세 추적 전략

1
Follow
1781
Followers
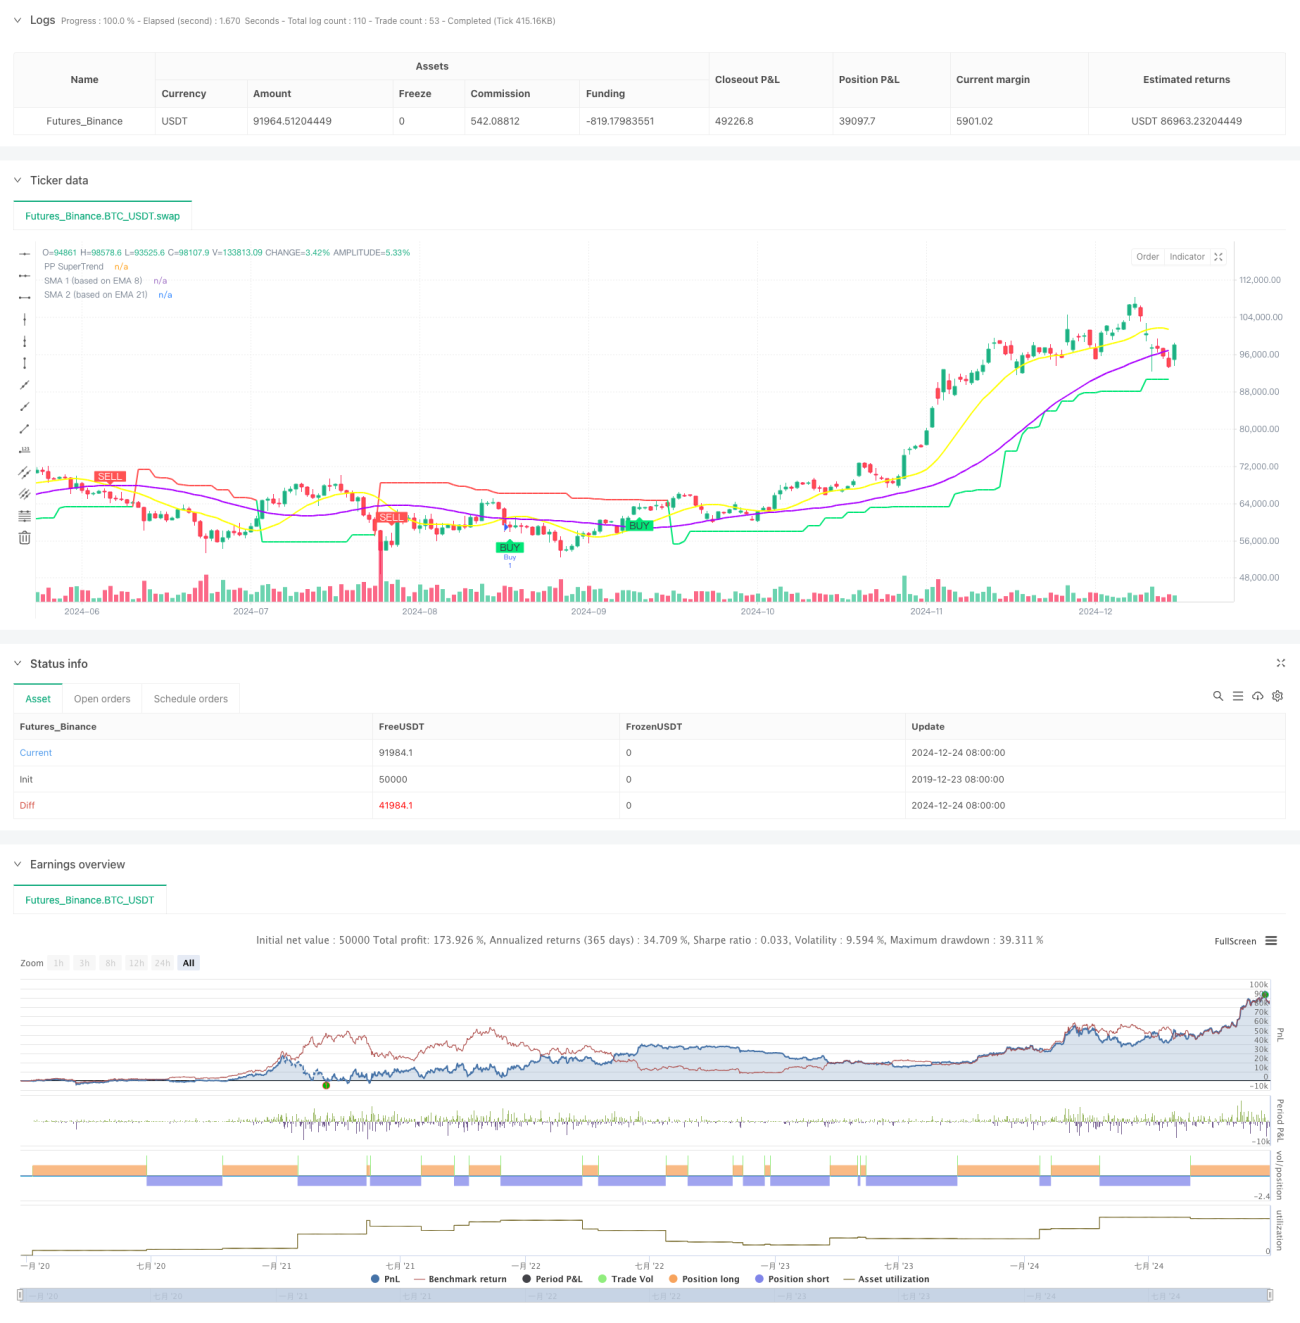
전략 개요
이 전략은 다중 기술 지표가 결합된 동적 트렌드 추적 시스템이다. 이 전략의 핵심 특징은 고정 시간 주기 분석 방법을 사용하여 신호의 일관성을 보장하고 동시에 지점의 검증을 통해 거래 신호의 신뢰성을 향상시키는 것이다.
전략 원칙
이 전략은 다음과 같은 핵심 메커니즘을 기반으로 운영됩니다.
- 고정된 시간 주기의 가격 데이터를 사용하여 분석하여 다른 시간 주기의 간섭을 피합니다.
- 8주기 및 21주기 EMA를 통해 SMA를 계산하여 트렌드 추적 기반을 형성합니다.
- 트렌드 방향을 확인하기 위해 ATR과 지점 계산 SuperTrend 지표
- 지점점 3주기에 걸쳐 나타나는 SMA 교차 신호만이 유효한 신호로 간주된다
- 동적으로 계산하고 거래 결정에 대한 지지를 / 저항을 추적
전략적 이점
- 다중 지표 크로스 검증, 신호 신뢰성 향상
- 고정 시간 주기 분석, 가짜 신호 간섭을 감소
- 거래가 중요한 가격 수준에서 이루어지는 것을 보장하는 점수 확인 메커니즘
- 동적 추적 지원 저항 지점, 스톱 스톱 위치를 확인하는 데 도움이
- 슈퍼 트렌드 지표의 사용은 트렌드 방향에 대한 추가적인 확인을 제공합니다.
- 다양한 시장 상황에 따라 조정할 수 있는 유연한 파라미터 설정
전략적 위험
- 여러 지표로 인해 신호 지연이 발생할 수 있습니다.
- 위축 시장에서 너무 많은 가짜 신호가 발생할 수 있습니다.
- 고정 시간 주기의 분석은 다른 주기의 중요한 신호를 놓칠 수 있습니다.
- 지점 인증 메커니즘은 중요한 거래 기회를 놓칠 수 있습니다.
- 매개 변수를 지나치게 최적화하면 과도한 적합성이 발생할 수 있습니다.
전략 최적화 방향
- 변동성 필터링 메커니즘을 도입하여 낮은 변동성 기간 동안 거래 빈도를 줄이십시오.
- ADX 또는 MACD와 같은 증가 추세 강도 확인 지표
- 시장 상황에 따라 동적으로 조정되는 변수 시스템을 개발
- 신호 신뢰성을 향상시키기 위해 거래량 분석을 추가하세요
- 동적 중지 메커니즘을 구현하여 시장의 변동에 따라 중지 위치를 조정합니다.
요약하다
이 전략은 여러 기술 지표를 결합하여 비교적 완전한 트렌드 추적 거래 시스템을 구축한다. 그것의 핵심 장점은 고정 시간 주기 분석과 지점 비트 검증을 통해 신호 신뢰성을 향상시키는 것이다. 약간의 지연 위험은 존재하지만, 매개 변수 최적화 및 위험 관리 조치를 통해 효과적으로 제어 할 수 있다.
Source
Pine
Strategy parameters
Related strategies
Comment
All comments (0)
No data
- 1