
1
Follow
1781
Followers
개요
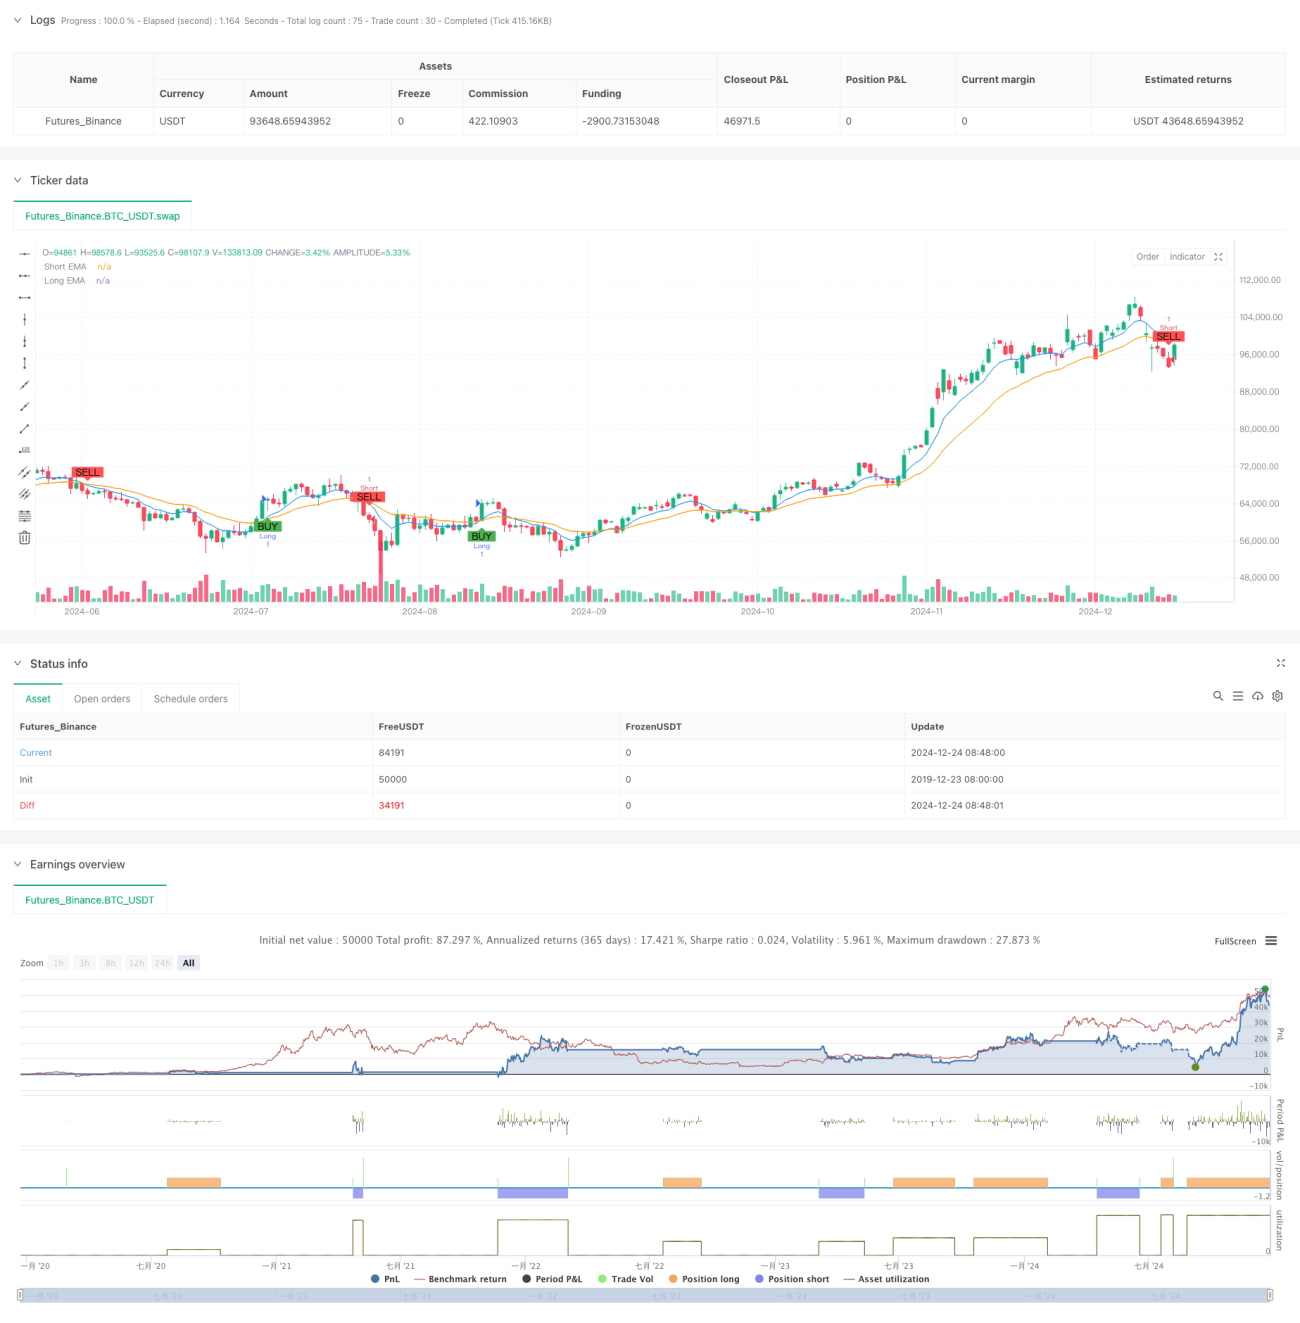
이것은 다중 기술 지표의 집합에 기초한 고주파 트레이딩 전략이다. 이 전략은 지수 이동 평균 ((EMA), 상대적으로 강한 지수 ((RSI), 거래량 분석 및 N주기 가격 형태 식별과 같은 여러 차원의 시장 신호를 결합하여 짧은 라인 거래에서 최적의 입문 시기를 찾습니다. 이 전략은 엄격한 위험 제어 메커니즘을 적용하여 스톱 손실을 설정하여 자금을 보호합니다.
전략 원칙
이 전략의 핵심 논리는 다차원 신호의 협동적 협동으로 거래 방향을 확인하는 것이다:
- 8주기 및 21주기 EMA의 교차를 사용하여 단기 트렌드 방향을 판단합니다.
- 14주기 RSI를 통해 시장 동력을 검증하고, RSI>50은 다목적 동력을 확인하고, RSI<50은 공허 동력을 확인한다
- 현재 거래량과 20주기 평균 거래량을 비교하여 시장의 활력을 보장합니다.
- 최근 5개의 K선과 이전 10개의 K선에서 가장 높고 가장 낮은 지점을 비교하여 잠재적인 반전 형태를 식별한다.
위의 신호가 동시에 충족될 때만, 전략은 거래 신호를 발송한다. 다중 신호가 나타나면 시장 가격으로 더 많이 열고, 공백 신호가 나타나면 시장 가격으로 공백한다. 동시에 1.5%의 스톱 스탠과 0.7%의 스톱 스탠을 설정하여 위험을 제어한다.
전략적 이점
- 다차원 신호 교차 검증, 가짜 신호의 영향을 크게 줄여줍니다.
- 트렌드 추적과 동력 거래의 장점을 결합하여 전략의 적응력을 향상시킵니다.
- 거래량 확인을 통해 시장이 맑은 시간에 거래하는 것을 피하십시오.
- N주기 형태인식으로 시장 역전 신호를 적시에 발견할 수 있다.
- 합리적인 스톱 스톱 손실 비율을 설정하여 위험을 효과적으로 제어하십시오.
- 정책 논리가 명확하여 지속적인 최적화 및 변수 조정이 가능합니다.
전략적 위험
- 높은 변동성 시장에서 자주 중단되는 경우
- 시장을 만드는 업체들의 제안 지연에 민감하다
- 여러 지표가 동시에 충족되는 기회는 상대적으로 적습니다.
- 불안한 시장에서 연속적인 상쇄 손실이 발생할 수 있습니다.
대책:
- 시장의 변동에 따라 조정할 수 있는 스톱 스톱 손실 비율
- 유동성이 좋은 시기에 거래하는 것이 좋습니다.
- 매개 변수 최적화를 통해 신호 수와 품질을 균형을 잡을 수 있습니다.
- 수익성을 높이기 위해 트레일링 스톱을 사용하는 것이 좋습니다.
전략 최적화 방향
- 시장 상황에 따라 정책을 자동으로 최적화 할 수 있도록 적응형 변수 조정 메커니즘을 도입합니다.
- 시장 변동율 필터를 추가하고 과도한 변동성 시장 환경에서 거래를 중단합니다.
- 역전 신호의 정확성을 높이기 위해 더 복잡한 N 주기 형태 인식 알고리즘을 개발
- 자산 관리 모듈을 도입하여 계좌의 순자치에 따라 지분 규모를 조정합니다.
- 더 많은 시간 주기 검증을 추가하여 신호의 신뢰도를 높여줍니다.
요약하다
이 전략은 다차원 기술 지표의 협동 협력으로 고주파 거래에서 우수한 거래 기회를 찾습니다. 전략 설계는 추세, 운동, 거래량과 같은 시장 특성을 충분히 고려하고 엄격한 위험 통제를 통해 안정성을 보장합니다. 약간의 최적화 공간이 있지만 전체적으로 논리적으로 명확하고 실용적인 거래 전략입니다.
Source
Pine
Strategy parameters
Related strategies
Comment
All comments (0)
No data
- 1