개요
이 전략은 지수 이동 평균 ((EMA) 와 상대적으로 약한 지표 ((RSI) 를 결합한 트렌드 역전 거래 시스템이다. 9주기 및 21주기 EMA의 교차 신호를 통해 RSI 지표가 50 수준에서 돌파구를 확인하고 거래자에게 정확한 트렌드 전환점을 제공합니다. 시스템은 고정된 스톱 스톱 손실 비율을 포함한 완전한 위험 제어 장치를 설계하여 반전을 효과적으로 제어합니다.
전략 원칙
전략의 핵심 논리는 빠른 EMA ((9주기) 와 느린 EMA ((21주기) 의 교차에 기반하며, RSI 지표를 사용하여 동력을 확인한다. 빠른 EMA가 느린 EMA를 상향으로 넘어가고 RSI가 50보다 크면, 시스템은 여러 신호를 낸다. 빠른 EMA가 느린 EMA를 상향으로 넘어가고 RSI가 50보다 작으면, 시스템은 평지 신호를 낸다.
전략적 이점
- 이중 확인 메커니즘: EMA 교차와 RSI 확인을 통해 결합하여 가짜 신호의 가능성을 크게 감소시킵니다.
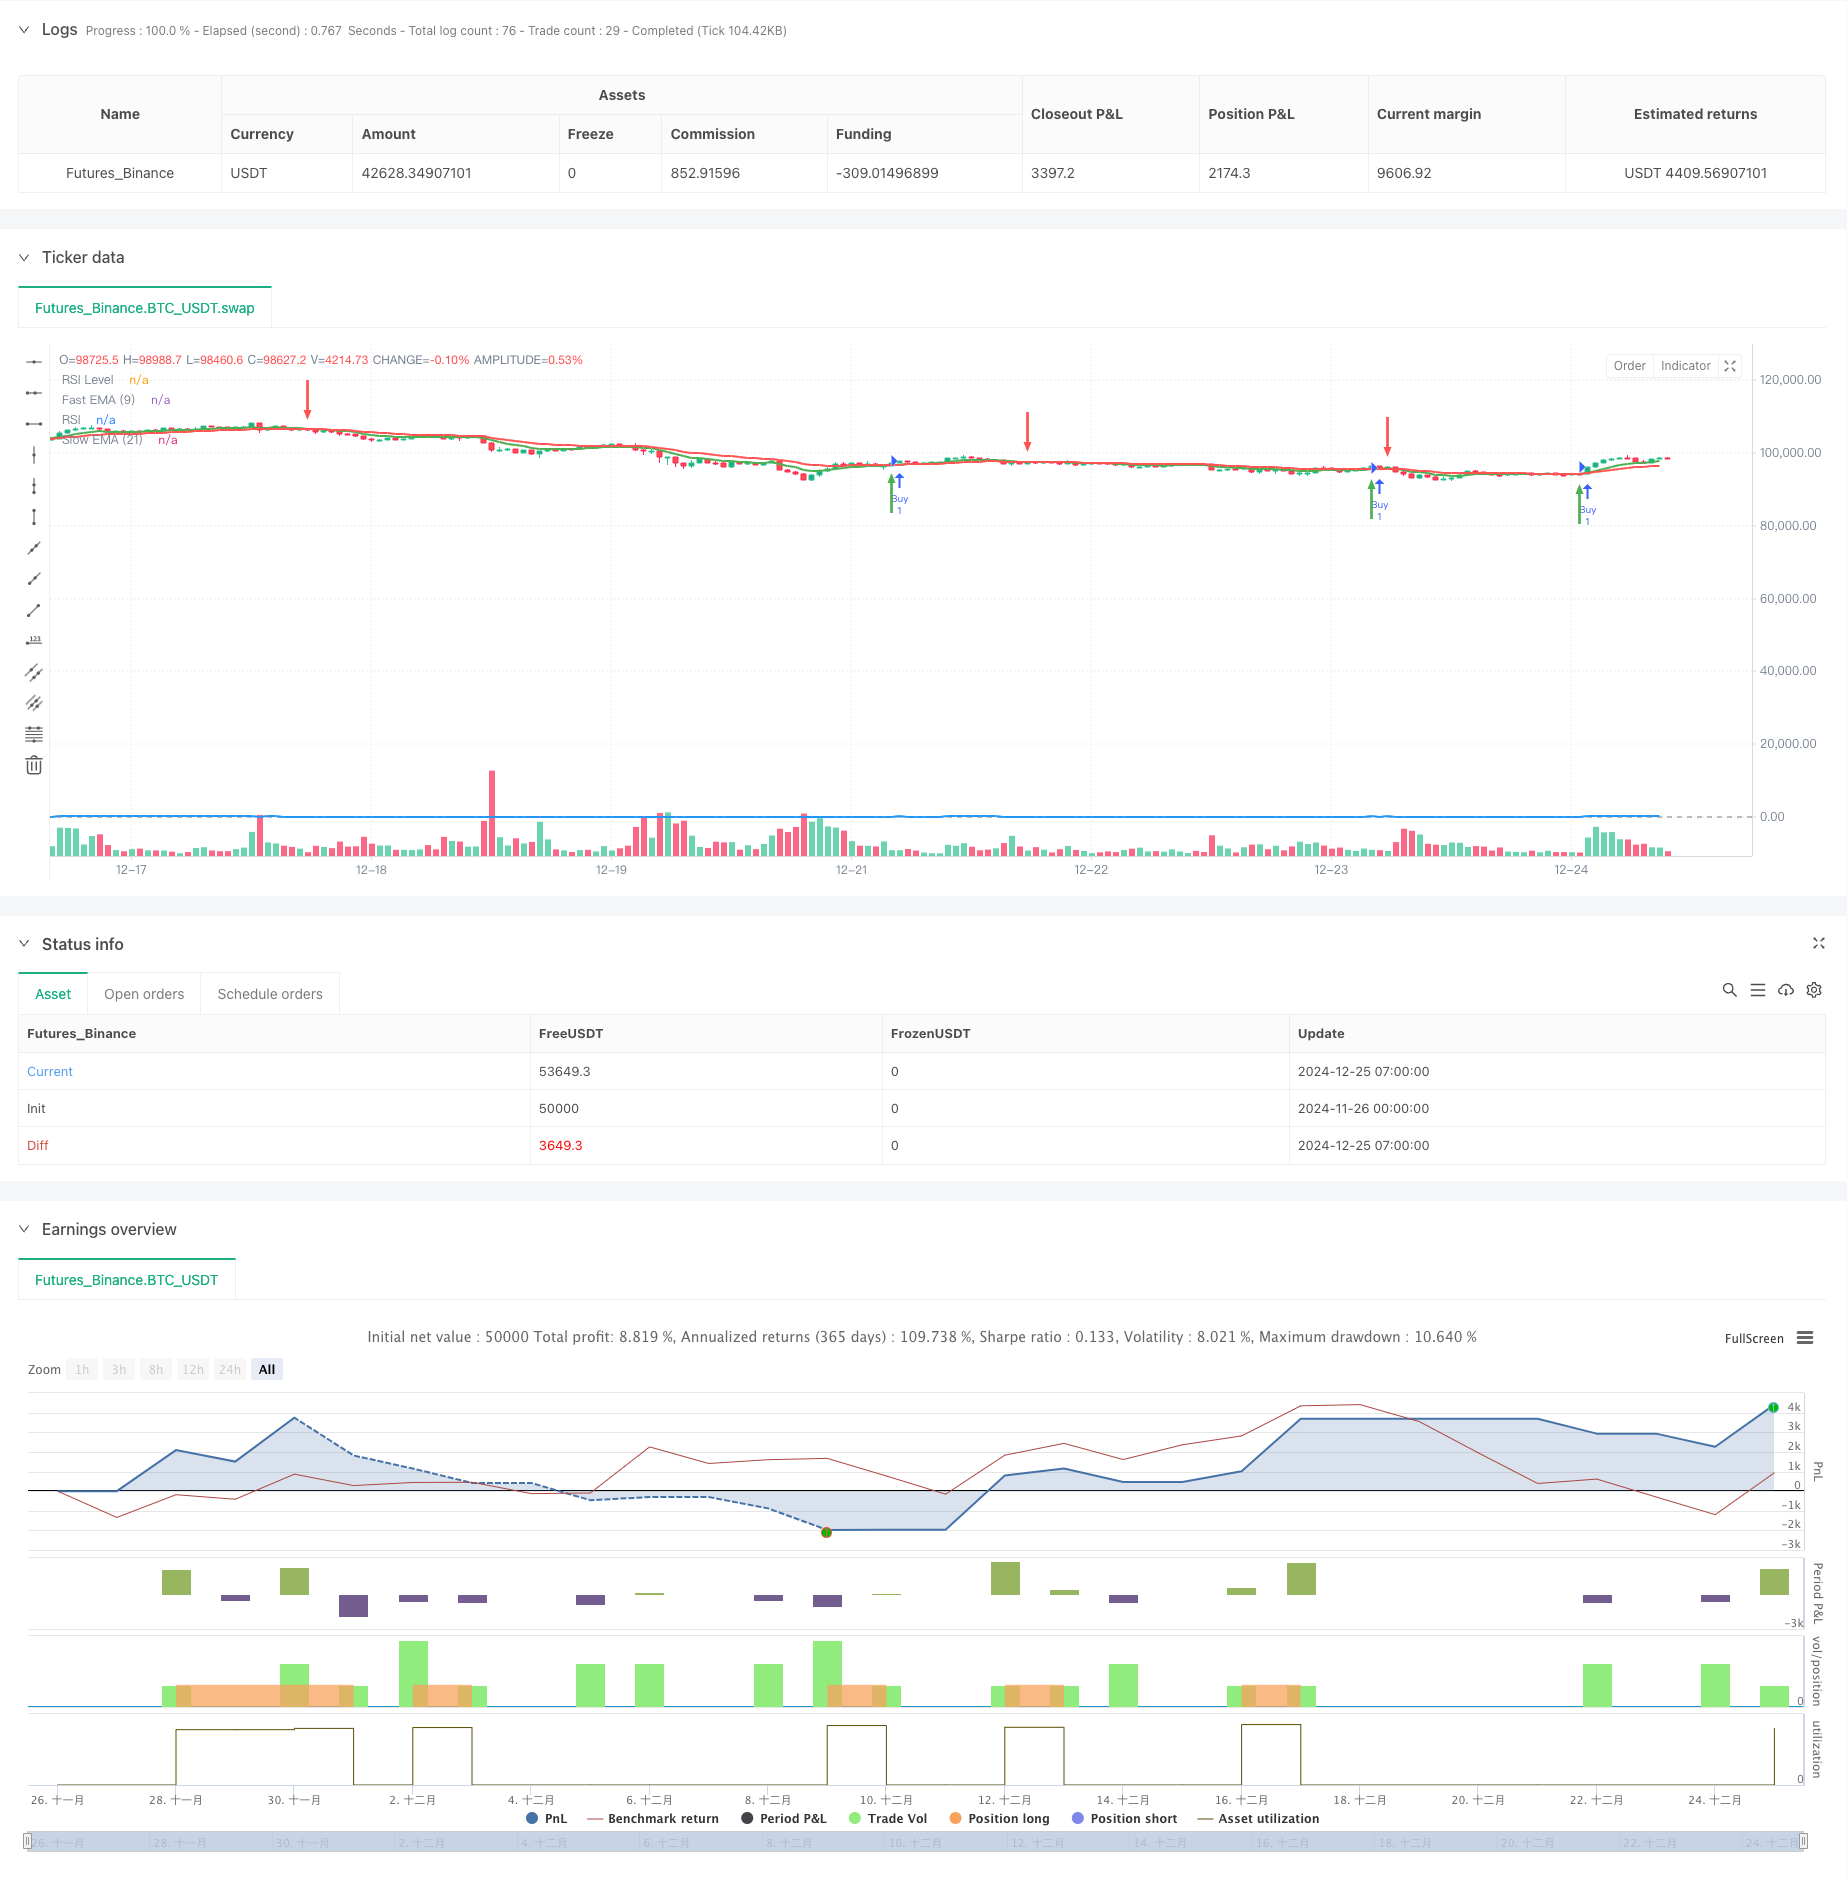
- 명확한 시각화: 녹색과 빨간색 화살표로 매매 지점을 표시하고 거래 신호가 직관적으로 명확합니다.
- 리스크 관리: 내장된 중지 중지 기능, 시장의 변동성에 따라 리스크 수익률을 유연하게 조정할 수 있습니다.
- 적응성: 핵심 매개 변수는 다양한 시장 환경과 거래 유형에 적응할 수 있습니다.
- 실행의 단순성: 거래 규칙이 명확하고 자동화된 거래 시스템 구현에 적합하다.
전략적 위험
- 수평 시장의 부실성: 간격적인 변동으로 인해 빈번한 잘못된 신호가 발생할 수 있습니다.
- 지연 위험: 이동 평균은 지연성이 있어 최고의 진입 시기를 놓칠 수 있다.
- RSI 오판: 극단적인 상황에서는 RSI 지표가 잘못된 신호를 줄 수 있습니다.
- 변수 감수성: 다른 시장 환경으로 인해 변수가 조정될 수 있으며, 전략 유지비용이 증가합니다. 해결책: 트렌드가 명확한 시장 환경에서는 ATR 지표를 추가하여 변동률 필터링을 수행하고 더 긴 주기 트렌드를 판단하는 것이 좋습니다.
전략 최적화 방향
- 변동성 필터 도입: ATR 지표를 추가하여 낮은 변동성 환경에서 거래를 중단하는 것이 좋습니다.
- 정지 중지 손실을 최적화: 추적 중지 또는 ATR 기반의 중지 손실 설정과 같은 동적 중지 사용이 고려될 수 있습니다.
- 트렌드 강도 필터링을 늘립니다: 더 긴 주기의 트렌드 지표를 도입하여 주 트렌드 방향으로만 거래 할 수 있습니다.
- 거래량 확인을 개선: 거래량 분석을 추가하여 신호 신뢰도를 높이는 것이 좋습니다.
- 시장 환경 분류: 다양한 시장 환경의 역동성에 따라 매개 변수를 조정하여 전략 적응력을 향상시킵니다.
요약하다
이 전략은 EMA와 RSI의 동력을 확인하는 EMA와 동력을 확인하는 EMA와 RSI의 동력을 확인하는 EMA와 RSI의 동력을 확인하는 EMA와 RSI의 동력을 확인하는 EMA와 RSI의 동력을 확인하는 EMA와 RSI의 동력을 확인하는 EMA와 RSI의 동력을 확인하는 EMA와 RSI의 동력을 확인하는 EMA와 RSI의 동력을 확인하는 EMA와 RSI의 동력을 확인하는 EMA와 RSI의 동력을 확인하는 EMA와 RSI의 동력을 확인하는 EMA의 동력을 확인하는 EMA와 RSI의 동력을 확인하는 EMA의 동력을 확인하는 EMA의 동력을 확인하는 EMA의 동력을 확인하는 EMA의 동력을 확인하는 EMA의 동력을 확인하는 EMA의 동력을 확인하는 EMA의 동력을 확인하는 EMA의 동력을 확인하는 EMA의 동력을 확인하는 EMA의 동력을 확인하는 EMA의 동력을 확인하는 EMA의 동력을 확인하는 EMA의 동력을 확인하는 EMA의 동력을 확인하는 EMA의 동력을 확인하는 EMA의
/*backtest
start: 2024-11-26 00:00:00
end: 2024-12-25 08:00:00
period: 1h
basePeriod: 1h
exchanges: [{"eid":"Futures_Binance","currency":"BTC_USDT"}]
*/

//@version=5
strategy("EMA Crossover with RSI Confirmation and Buy/Sell Signals", overlay=true)

// Input for EMAs and RSI
fastLength = input.int(9, title="Fast EMA Length")
slowLength = input.int(21, title="Slow EMA Length")
rsiLength = input.int(14, title="RSI Length")
rsiLevel = input.int(50, title="RSI Level", minval=0, maxval=100)

// Calculate the EMAs and RSI
fastEMA = ta.ema(close, fastLength)
slowEMA = ta.ema(close, slowLength)
rsi = ta.rsi(close, rsiLength)

// Plot the EMAs on the chart
plot(fastEMA, color=color.green, linewidth=2, title="Fast EMA (9)")
plot(slowEMA, color=color.red, linewidth=2, title="Slow EMA (21)")

// Plot the RSI on a separate pane (below the chart)
hline(rsiLevel, "RSI Level", color=color.gray)
plot(rsi, color=color.blue, linewidth=2, title="RSI")

// Buy condition: Fast EMA crosses above Slow EMA and RSI crosses above 50
buyCondition = ta.crossover(fastEMA, slowEMA) and rsi > rsiLevel

// Sell condition: Fast EMA crosses below Slow EMA and RSI crosses below 50
sellCondition = ta.crossunder(fastEMA, slowEMA) and rsi < rsiLevel

// Execute trades based on conditions
if (buyCondition)
    strategy.entry("Buy", strategy.long)
    label.new(bar_index, low, "Buy", color=color.green, textcolor=color.white, style=label.style_label_up, size=size.small)

if (sellCondition)
    strategy.close("Buy")
    label.new(bar_index, high, "Sell", color=color.red, textcolor=color.white, style=label.style_label_down, size=size.small)

// Strategy exit (optional): Fixed risk-to-reward ratio (take profit and stop loss)
takeProfit = input.int(2, title="Take Profit (Risk-Reward)", minval=1)
stopLoss = input.int(1, title="Stop Loss (Risk-Reward)", minval=1)

strategy.exit("Exit Buy", "Buy", stop=close * (1 - stopLoss / 100), limit=close * (1 + takeProfit / 100))

// Plot buy/sell arrows for visualization
plotarrow(buyCondition ? 1 : na, offset=-1, colorup=color.green, maxheight=30, title="Buy Signal Arrow")
plotarrow(sellCondition ? -1 : na, offset=-1, colordown=color.red, maxheight=30, title="Sell Signal Arrow")