개요
이 전략은 황소 시장의 지지대 (Bull Market Support Band) 를 기반으로 한 트렌드 추적 거래 시스템이다. 그것은 주로 20 주 간단한 이동 평균 (SMA) 과 21 주 지수 이동 평균 (EMA) 의 교차 신호를 사용하여 시장의 경향 방향을 결정하고 거래 결정을 내린다. 이 전략은 두 개의 평행선이 위쪽으로 교차 할 때 더 많은 신호를 발산하고, 아래쪽으로 교차 할 때 평점, 중장기 트렌드 기회를 포착하여 수익을 얻는다.
전략 원칙
전략의 핵심 논리는 20주 SMA와 21주 EMA의 두 평선 사이의 상대적인 위치 관계를 모니터링하여 시장의 추세를 판단하는 것이다. 단기 평선 ((20주 SMA) 이 아래에서 장기 평선 ((21주 EMA) 을 돌파할 때, 시장이 상승 추세를 형성할 수 있음을 나타낸다면, 이 때 시스템은 더 많은 포지션을 열 것이다. 단기 평선이 위에서 상승 추세가 끝날 수 있음을 나타낸다면, 이 때 시스템은 평점 포지션을 출전한다. 전략은 %_of_equity 방식을 사용하여 포지션을 관리하며 거래 수수료를 0.1점으로 설정하고, 3개 기준점으로 이동한다.
전략적 이점
- 트렌드 추적성: 경로 레벨의 평균선 교차로 트렌드를 판단하여 단기 시장 소음을 효과적으로 필터링하여 중기 및 장기 트렌드 기회를 잡을 수 있습니다.
- 합리적인 위험 관리: 동적 이동 평균을 스톱 레퍼런스로 사용하여 시장의 전환에 적시에 퇴출 할 수 있습니다.
- 매개 변수 설정 과학: 20주 및 21주 매개 변수 설정은 신호의 안정성을 보장하고 과도한 지연을 발생시키지 않습니다.
- 실행 논리 명확성: 입력 및 출력 신호가 명확하고, 주관적 판단의 요소가 없습니다.
- 자금 관리의 유연성: 계좌의 순자치 비율에 따라 포지션을 개설할 수 있으며 포지션 규모를 동적으로 조정할 수 있습니다.
전략적 위험
- 흔들림 시장은 적용되지 않습니다: 수평 변동 시장에서, 평균 선의 빈번한 교차는 가짜 돌파구를 유발하여 연속적인 손실을 초래할 수 있습니다.
- 더 큰 슬라이드 영향: 주파수 레벨의 거래는 전략의 성과에 영향을 미치는 실제 화면에서 더 큰 슬라이드 영향을받을 수 있습니다.
- 진입 시간 지연: 평균선 교차 신호는 자연적으로 지연성이 있으며, 최적의 진입 지점을 놓칠 수 있다.
- 철회 제어 부족: 평행선 교차로만 스톱 신호로 의존하고, 급격한 변동이 있을 때 더 큰 철수를 견딜 수 있다.
- 높은 자본 요구: 주경계 수준의 거래는 자본량과 심리적 용량에 대한 높은 요구가 있습니다.
전략 최적화 방향
- 필터링 지표를 추가: RSI, MACD와 같은 지표를 도입하여 트렌드를 확인하고 신호 신뢰성을 향상시킬 수 있습니다.
- 최적화된 스톱 메커니즘: ATR 지표 설정과 함께 다이내믹 스톱으로 리스크 제어 능력을 향상시킵니다.
- 포지션 관리를 개선: 시장의 변동에 따라 포지션 크기를 조정하여 더 나은 자금 관리를 달성합니다.
- 트렌드 필터 추가: 장기 주기 트렌드 판단을 도입하여 주 트렌드 방향으로만 거래
- 거래 실행 개선: 슬라이포인트 영향을 줄이고 전략 안정성을 높이기 위해 거래 규칙을 최적화합니다.
요약하다
불시장 지지대 거래 전략은 고전적인 기술 분석 이론에 기반한 트렌드 추적 시스템이다. 중간 및 장기적인 트렌드적 기회를 포착하기 위해 회선 수준의 평평선 교차를 통해 논리적으로 명확하고, 위험을 제어할 수 있는 특징이 있다. 그러나 전략은 흔들리는 시장에서 좋지 않은 성능을 발휘하지 않으며, 약간의 낙후성이 있다. 보조 지표를 추가하고, 손해 방지 장치를 최적화하고, 자금 관리를 개선함으로써, 전략에는 큰 최적화 공간이 있다.
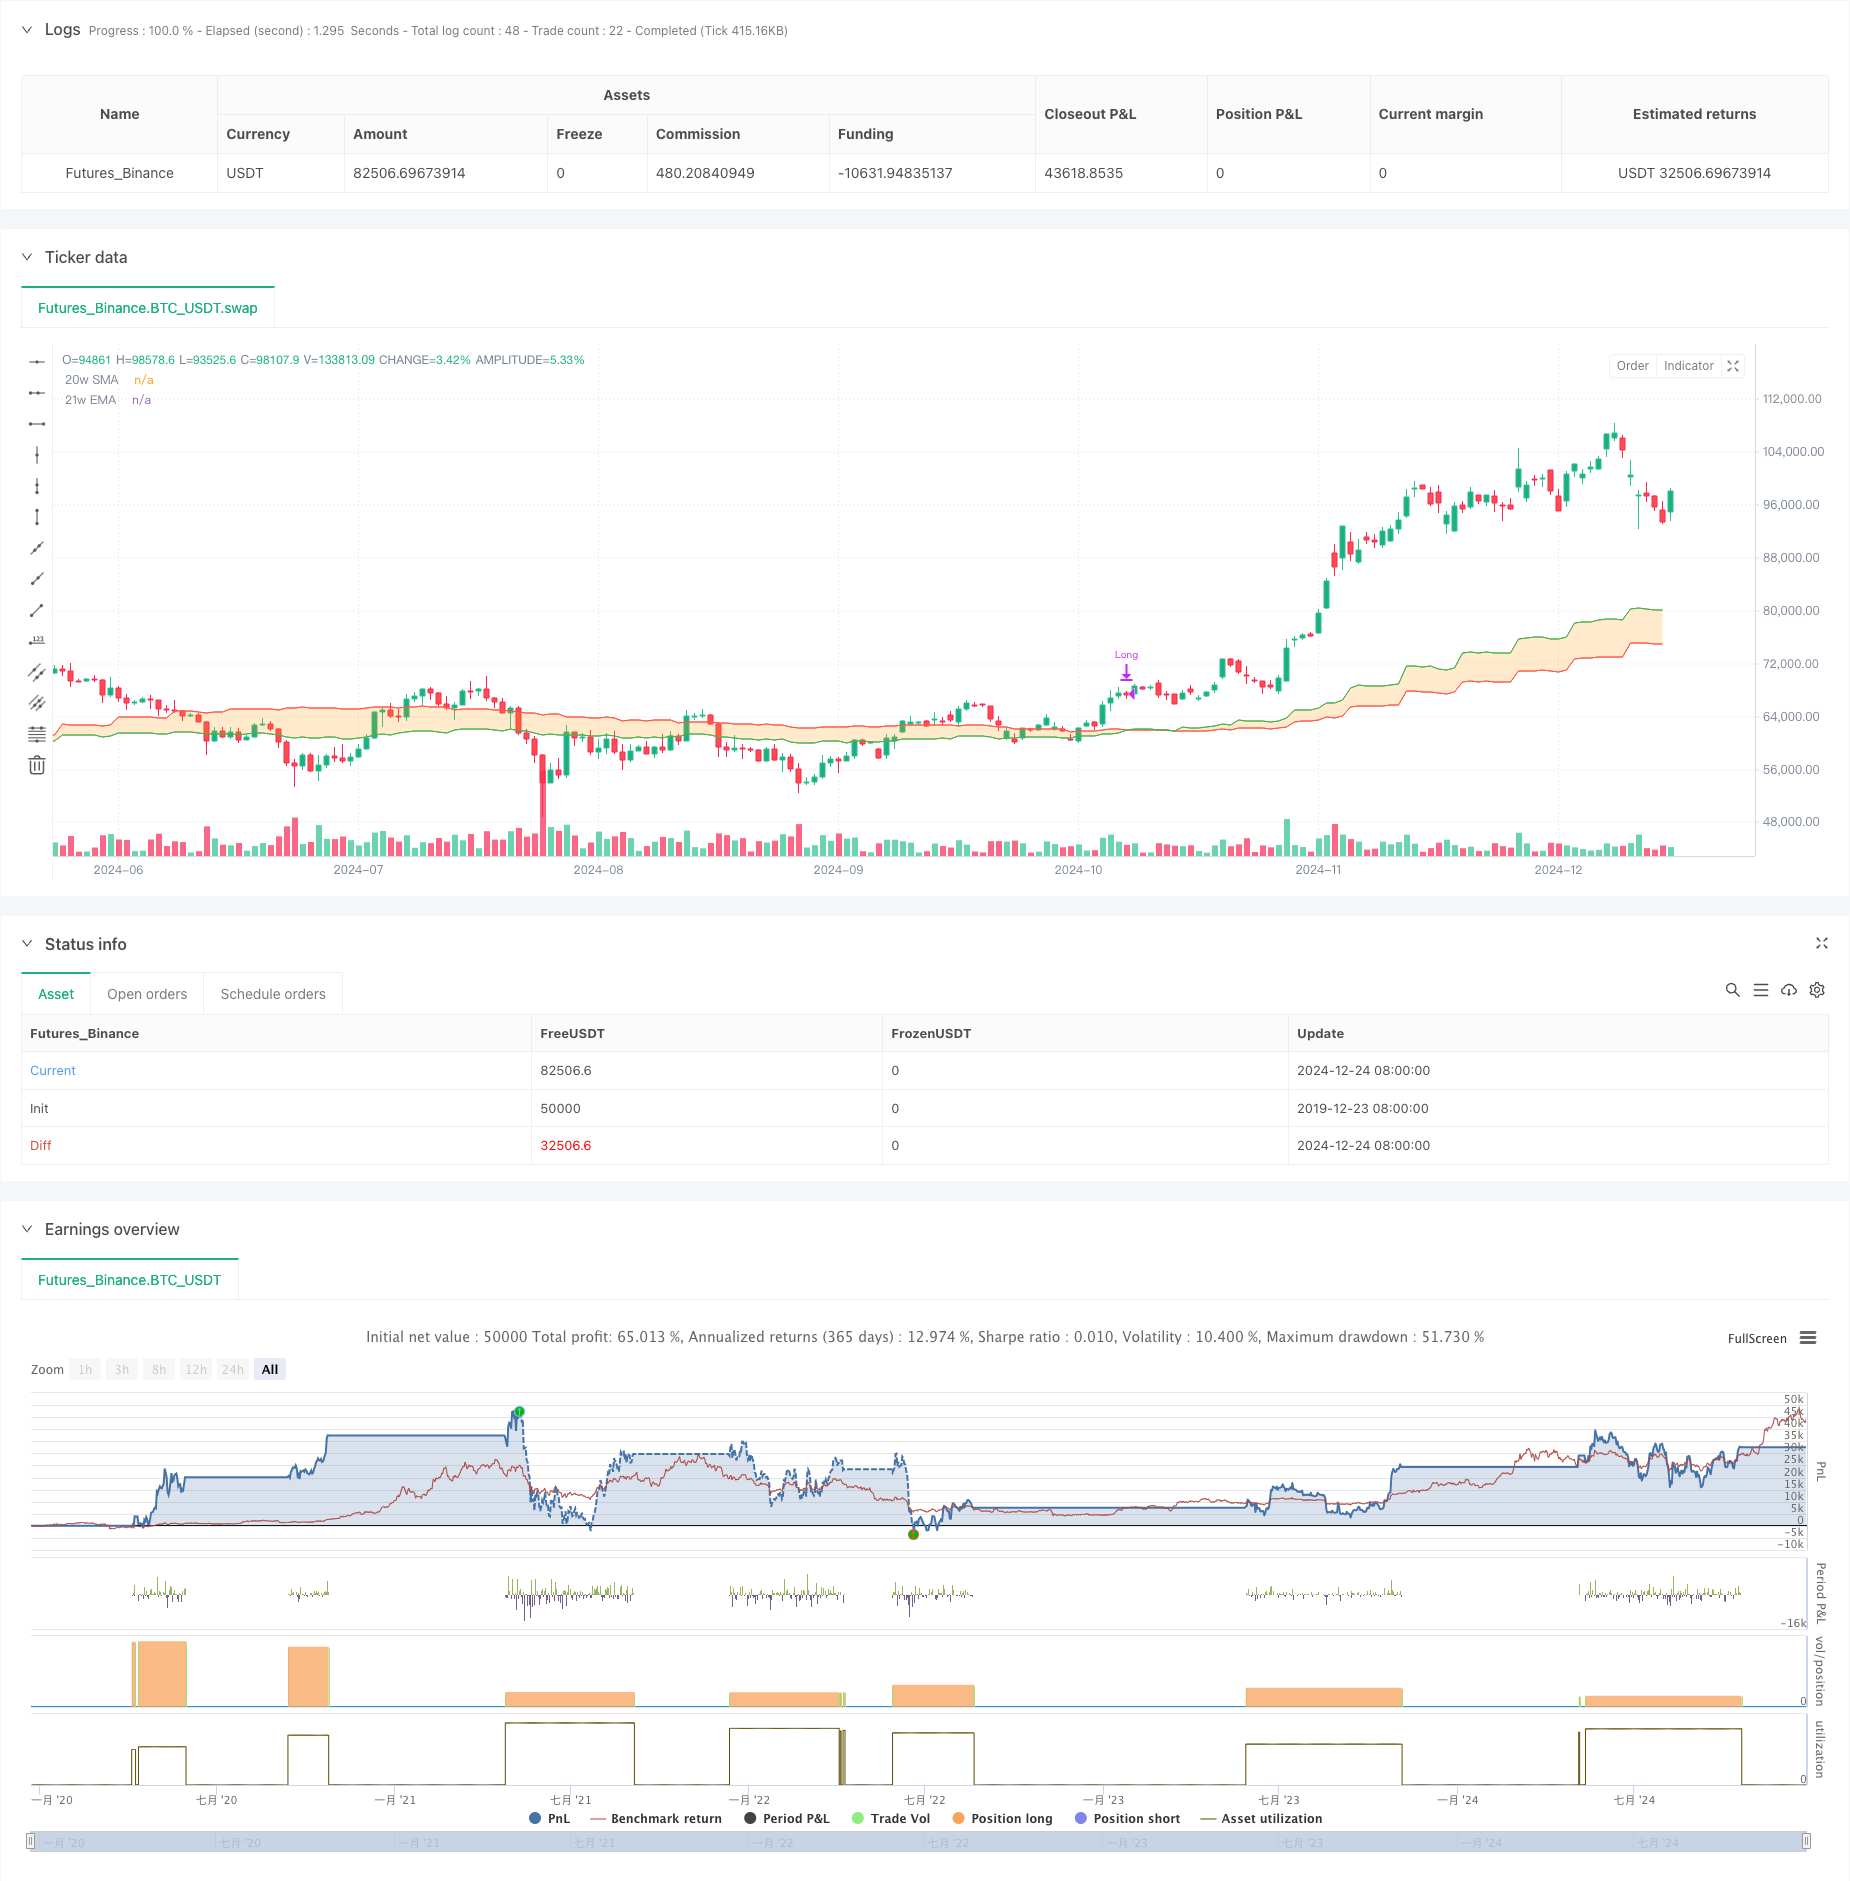
/*backtest
start: 2019-12-23 08:00:00
end: 2024-12-25 08:00:00
period: 1d
basePeriod: 1d
exchanges: [{"eid":"Futures_Binance","currency":"BTC_USDT"}]
*/

// This source code is subject to the terms of the Mozilla Public License 2.0
// © zkdev

//@version=6
strategy(title='Demo GPT - Bull Market Support Band',
     overlay=true,
     default_qty_type=strategy.percent_of_equity,
     default_qty_value=100,
     commission_type=strategy.commission.percent,
     commission_value=0.1,
     slippage=3)

// -------------------------------------------------------------------------
// Compile-time timestamp constants for default date range
// (2018-01-01 00:00:00 UTC -> 1514764800000
//  2069-12-31 23:59:59 UTC -> 3155759999000)
// -------------------------------------------------------------------------
const int defaultFromDate = 1514764800000
const int defaultToDate   = 3155759999000

// -------------------------------------------------------------------------
// Inputs: date range
// -------------------------------------------------------------------------
fromDate = input(title='Start Date', defval=defaultFromDate)
toDate   = input(title='End Date',   defval=defaultToDate)

// -------------------------------------------------------------------------
// Indicator settings & calculations
// -------------------------------------------------------------------------
smaLength = 20
emaLength = 21

source = close
sma    = ta.sma(source, smaLength)
ema    = ta.ema(source, emaLength)

// -------------------------------------------------------------------------
// Fetch weekly SMA & EMA
// -------------------------------------------------------------------------
outSma = request.security(syminfo.tickerid, 'W', sma, gaps=barmerge.gaps_on, lookahead=barmerge.lookahead_off)
outEma = request.security(syminfo.tickerid, 'W', ema, gaps=barmerge.gaps_on, lookahead=barmerge.lookahead_off)

// -------------------------------------------------------------------------
// Plot visuals (20w SMA, 21w EMA, fill in between)
// -------------------------------------------------------------------------
smaPlot = plot(outSma, color=color.new(color.red,   0), title='20w SMA')
emaPlot = plot(outEma, color=color.new(color.green, 0), title='21w EMA')
fill(smaPlot, emaPlot, color=color.new(color.orange, 75), fillgaps=true)

// -------------------------------------------------------------------------
// We evaluate crossover/crossunder on *every bar* and store the result
// -------------------------------------------------------------------------
crossUp   = ta.crossover(outSma, outEma)
crossDown = ta.crossunder(outSma, outEma)

// -------------------------------------------------------------------------
// Trade logic: only operate within chosen date range
// Buy when outSma crosses above outEma; Sell (close) when outSma crosses below outEma
// -------------------------------------------------------------------------
inDateRange = true

if inDateRange
    // If we have a crossUp event on this bar, buy (go Long)
    if crossUp
        strategy.entry('Long', strategy.long)

    // If we have a crossDown event on this bar, sell (close Long)
    if crossDown
        strategy.close('Long')