정규화된 대수 수익률에 기반한 적응형 동적 거래 전략

1
Follow
1781
Followers
개요
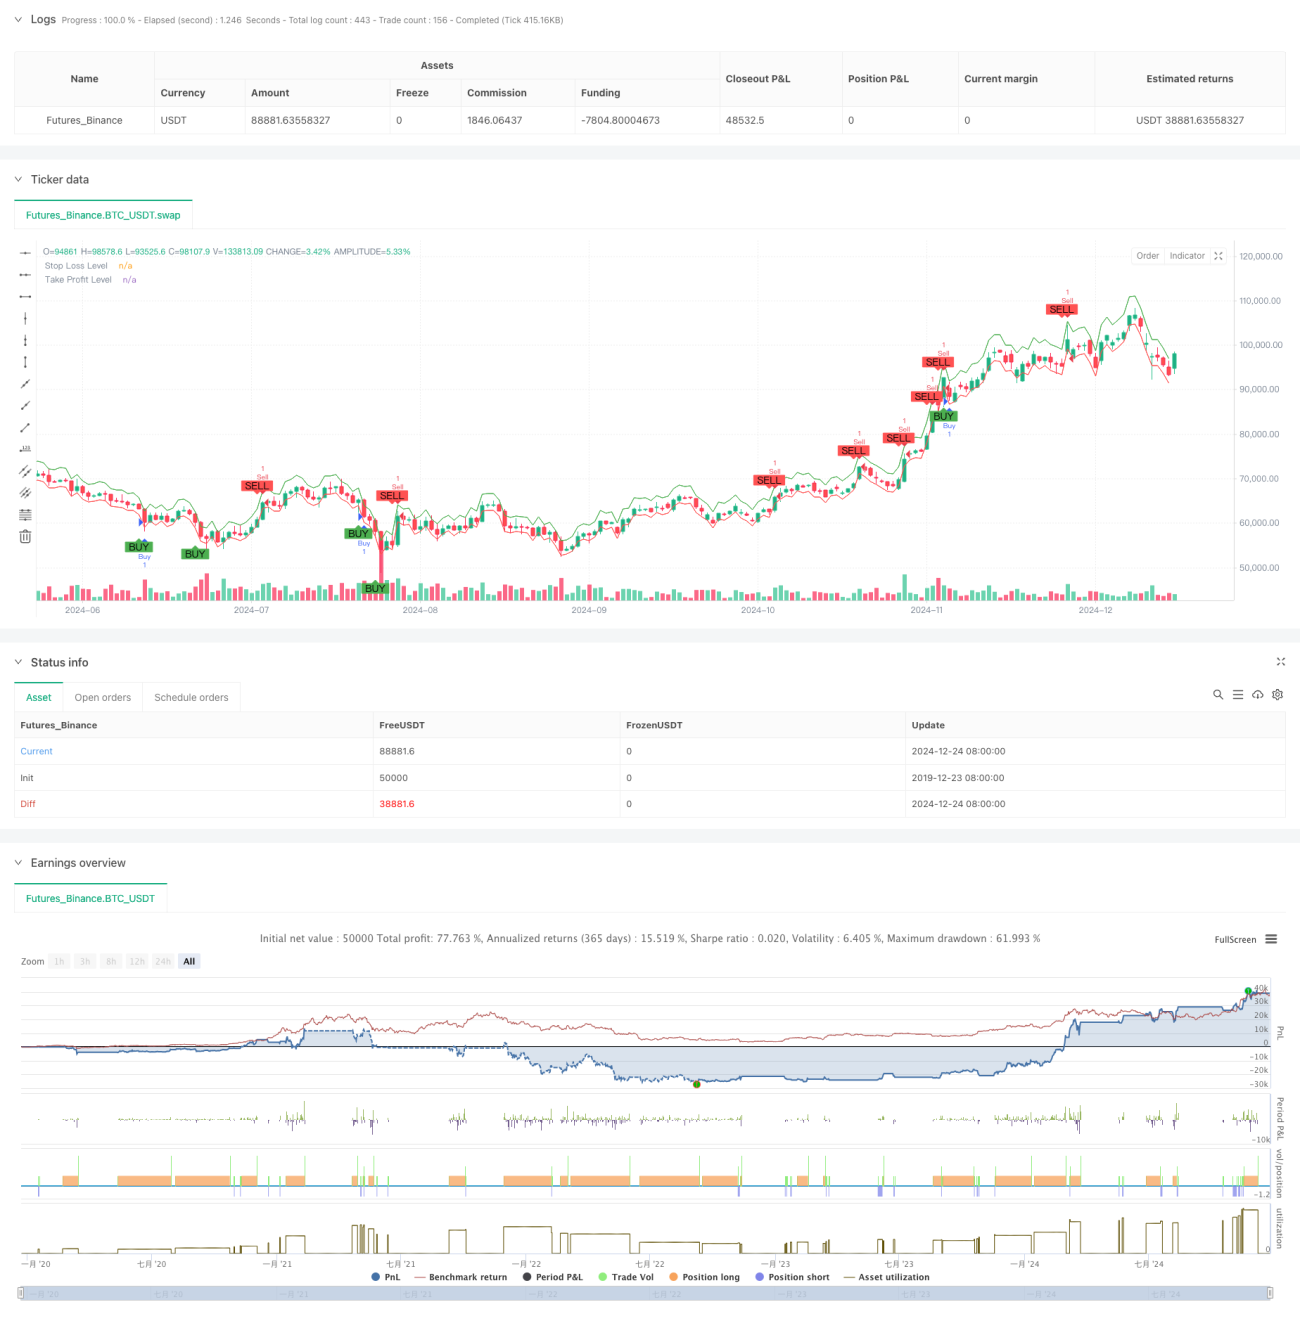
이 전략은 Shiryaev-Zhou 지수 ((SZI) 를 기반으로 한 자기 적응 거래 시스템이다. 이 전략은 상수 수익률의 표준화 점수를 계산하여 시장의 과매매와 과매매 상태를 식별하여 가격의 평균 회귀 기회를 잡는다. 이 전략은 동적인 중지 및 수익 목표를 결합하여 위험을 정확하게 제어한다.
전략 원칙
전략의 핵심은 대칭 수익률의 롤링 통계적 특성을 통해 표준화 지표를 구축하는 것입니다. 구체적인 단계는 다음과 같습니다:
- 이수 수익률을 계산하여 이수 수익률의 정형화 처리를 달성합니다.
- 50주기 창을 사용하여 이동 평균과 표준 차이를 계산합니다.
- SZI 지표를 구성: (대수수익률 - 롤링 평균) / 롤링 표준 차
- SZI가 -2보다 낮으면 다중 신호가 발생하고, 2.0보다 높으면 공백 신호가 발생
- 입점 가격에 기반한 2%의 스톱로스 및 4%의 스톱<unk> 레벨을 설정합니다.
전략적 이점
- 이론적 기초는 견고하다: 대칭 정형 분포 가설에 기초하고, 통계학적으로도 잘 뒷받침된다.
- 자기 적응력: 롤링 창을 통해 시장의 변동 특성에 적응할 수 있다.
- 리스크 관리가 완벽하다: 거래 당 위험을 정확하게 제어하기 위해 비율 상쇄 전략을 사용합니다.
- 시각화 친화적: 거래 신호와 위험 제어 수준을 차트에 명확하게 표시
전략적 위험
- 변수 민감성: 스크롤 창 길이와 <unk>값의 선택은 전략의 성능에 큰 영향을 미칩니다.
- 시장 환경 의존성: 트렌드 시장에서 빈번하게 잘못된 신호가 발생할 수 있습니다.
- 슬라이드 포인트 효과: 급격한 변동 기간 동안 실제 거래 가격은 이상적인 수준에서 크게 벗어날 수 있습니다.
- 계산 지연: 실시간 계산 통계 지표는 약간의 신호 지연을 일으킬 수 있습니다.
전략 최적화 방향
- 동적 하락: 시장의 변동에 따라 동적으로 조정할 수 있는 신호 하락
- 다중 시간 주기: 여러 시간 주기를 도입한 신호 확인 메커니즘
- 변동율 필터: 극심한 변동성 동안 거래를 중지하거나 위치를 조정합니다.
- 신호 확인: 증가 된 수량, 동력 등 보조 지표를 위해 신호 확인
- 포지션 관리: 변동률 기반의 동적 포지션 관리
요약하다
이것은 탄탄한 통계학에 기반을 둔 정량 거래 전략이며, 표준화된 대수적 수익을 통해 가격 변동 기회를 포착한다. 전략의 주요 장점은 자율성과 완벽한 위험 통제에 있다. 그러나 매개 변수 선택과 시장 환경 적응성에 있어서는 여전히 최적화 할 여지가 있다. 동적 하락과 다차원 신호 확인 메커니즘을 도입함으로써 전략의 안정성과 신뢰성이 더욱 향상될 전망이다.
Source
Pine
Strategy parameters
Comment
All comments (0)
No data
- 1