동적 확률적 상대 강도 지수 2라인 크로스오버 적응형 트레이딩 전략

1
Follow
1781
Followers
개요
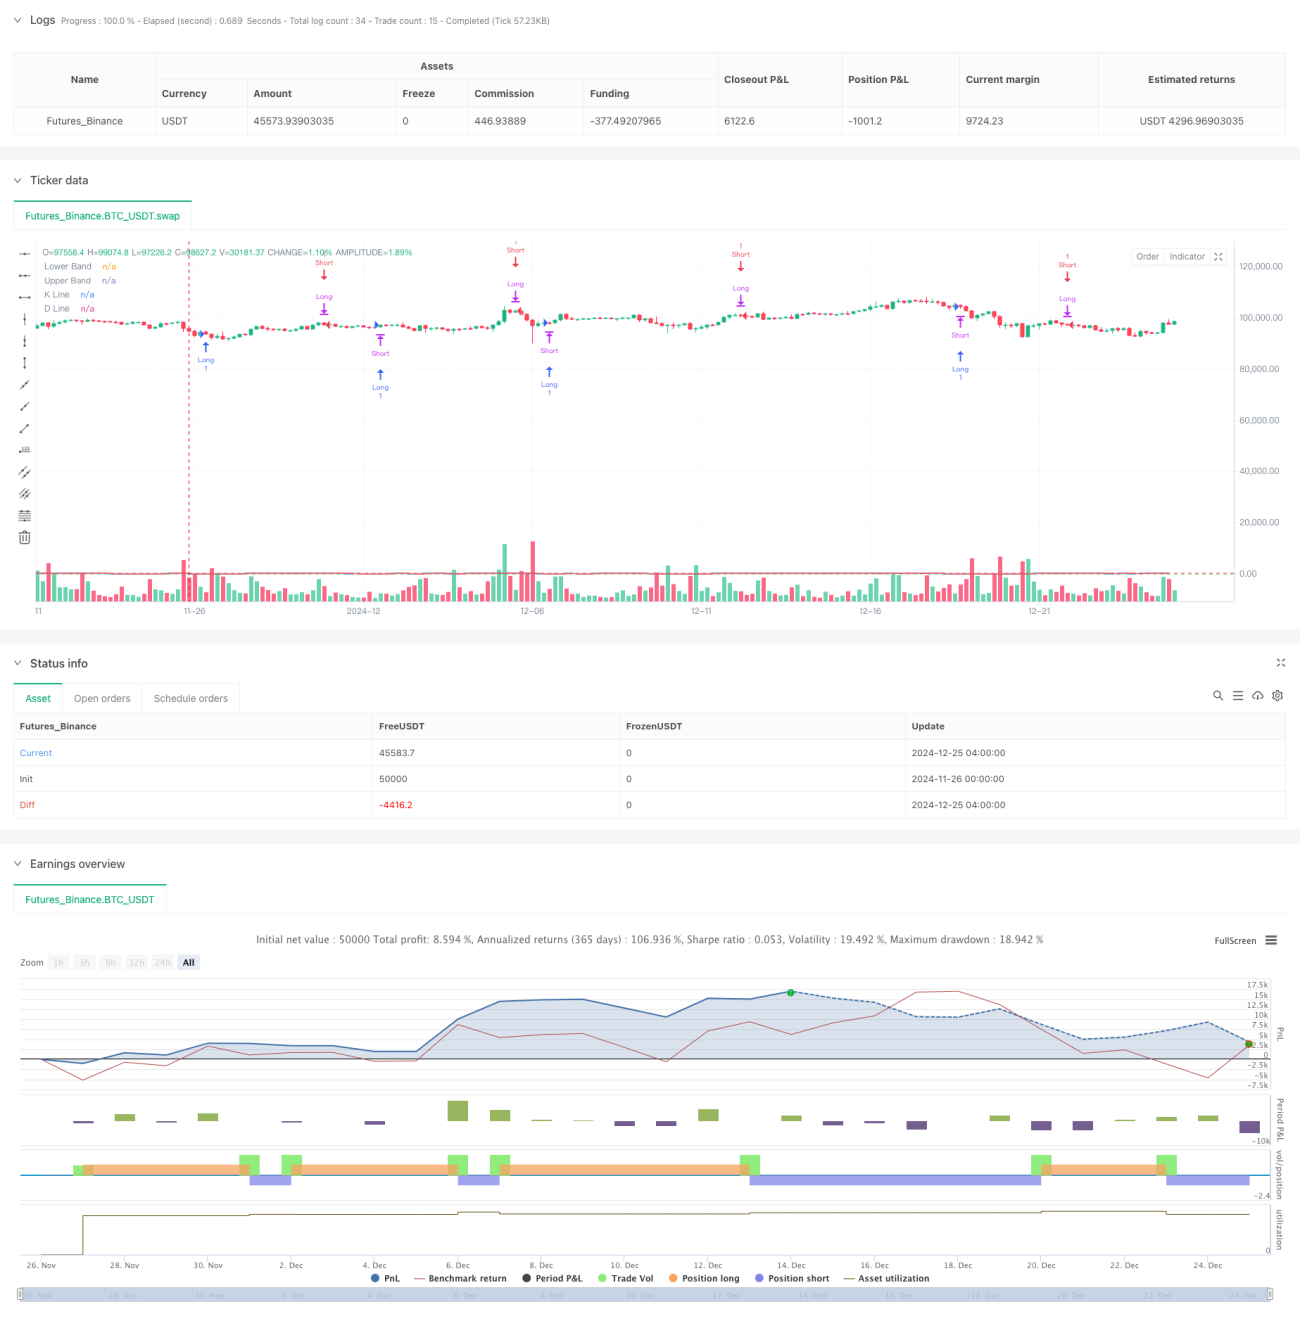
이 전략은 과매수 및 과매도 영역에서 K-라인과 D-라인의 교차 신호를 모니터링하여 거래 결정을 내리는 스토캐스틱 RSI(Stochastic RSI)를 기반으로 한 적응형 거래 시스템입니다. 이 전략은 기존 RSI와 확률적 지표의 장점을 통합하여 가격 모멘텀과 변동성을 이중으로 확인함으로써 더욱 신뢰할 수 있는 거래 신호를 제공합니다.
전략 원칙
전략의 핵심 논리는 다음과 같은 핵심 단계에 기초합니다.
- 먼저, 가격의 상대적 강도를 파악하기 위해 전통적인 RSI 지표를 계산합니다.
- RSI 값에 대한 확률적 계산을 수행하여 더욱 민감한 모멘텀 지표를 얻으십시오.
- 단순 이동 평균(SMA)을 사용하여 Stochastic RSI를 부드럽게 하고 K 및 D 라인을 생성합니다.
- 매수과잉 및 매도과잉 영역(20/80)에서 필터 조건을 설정하여 고품질 거래 기회를 찾으세요.
- K라인이 D라인을 20 이하로 상향 교차할 경우 숏포지션을 종료하고 롱포지션을 오픈합니다.
- K라인이 D라인을 80위 아래로 교차할 경우 롱포지션을 닫고 숏포지션을 오픈합니다.
- 시간 필터를 통해 거래 주기를 제한하여 전략 적응성을 개선합니다.
전략적 이점
- 높은 신호 신뢰성: RSI와 확률 지표의 이중 확인을 통해 거짓 돌파 위험이 크게 감소합니다.
- 강력한 적응성: 매개변수는 다양한 시장 상황에 따라 유연하게 조정될 수 있습니다.
- 개선된 위험 관리: 매수 과다 및 매도 과다 영역을 제한하여 추세가 지속될 때 조기 진입을 방지합니다.
- 명확한 실행 메커니즘: 주관적 판단을 줄이기 위해 교차 신호를 트리거 조건으로 사용
- 우수한 확장성: 시간 필터링 인터페이스는 추가 최적화를 위해 예약되어 있습니다.
전략적 위험
- 변동성 있는 시장의 위험: 횡보 및 변동성 있는 시장에서는 빈번한 거래가 발생할 수 있습니다.
- 지연 위험: 이동 평균 평활화로 인해 신호 지연이 발생할 수 있습니다.
- 매개변수 민감도: 매개변수 조합이 다양하면 전략 성능에 큰 차이가 생길 수 있습니다.
- 시장 환경 의존성: 강세장세에서 일부 수익 놓칠 수 있음
위험 관리 제안:
- 시장 환경을 판단하기 위해 변동성 지표를 결합하는 것이 좋습니다.
- 위험 대비 수익률을 개선하기 위해 손절매 및 이익 실현 메커니즘을 추가할 수 있습니다.
- 동적 매개변수 적응 메커니즘 사용을 고려하세요
- 역추세 거래를 피하기 위해 추세 필터를 추가하세요
전략 최적화 방향
- 동적 매개변수 최적화:
- 시장 변동성에 따라 매수 과다 및 매도 과다 임계값을 동적으로 조정합니다.
- 머신 러닝을 통한 매개변수 조합 최적화
- 신호 최적화:
- 거래량 확인 메커니즘 추가
- 추세 확인 지표 추가
- 다중 시간 프레임 협업 분석 실현
- 위험 관리 최적화:
- 동적 위치관리 실현
- 트레일링 스톱 메커니즘 추가
- 지능형 수익 실현 솔루션 설계
- 실행 메커니즘 최적화:
- 주문 실행 타이밍 최적화
- 부분 위치 작업 구현
- 미끄러짐 제어 메커니즘 추가
요약하다
이 전략은 RSI와 확률론적 지표의 장점을 결합하여 신뢰할 수 있는 거래 시스템을 만듭니다. 이 전략의 핵심 장점은 신호의 신뢰성과 시스템의 확장성에 있습니다. 합리적인 매개변수 설정과 위험 제어 메커니즘을 통해 다양한 시장 환경에서 안정적인 성과를 유지할 수 있습니다. 거래자는 특정 시장 특성에 따라 매개변수를 조정하고 실제 거래에서 이를 사용할 때 위험 관리에 주의를 기울이는 것이 좋습니다.
Source
Pine
Strategy parameters
Related strategies
Comment
All comments (0)
No data
- 1