동적 이동 평균 추세 추적 및 상대 강도 지수 확인 거래 전략

1
Follow
1781
Followers
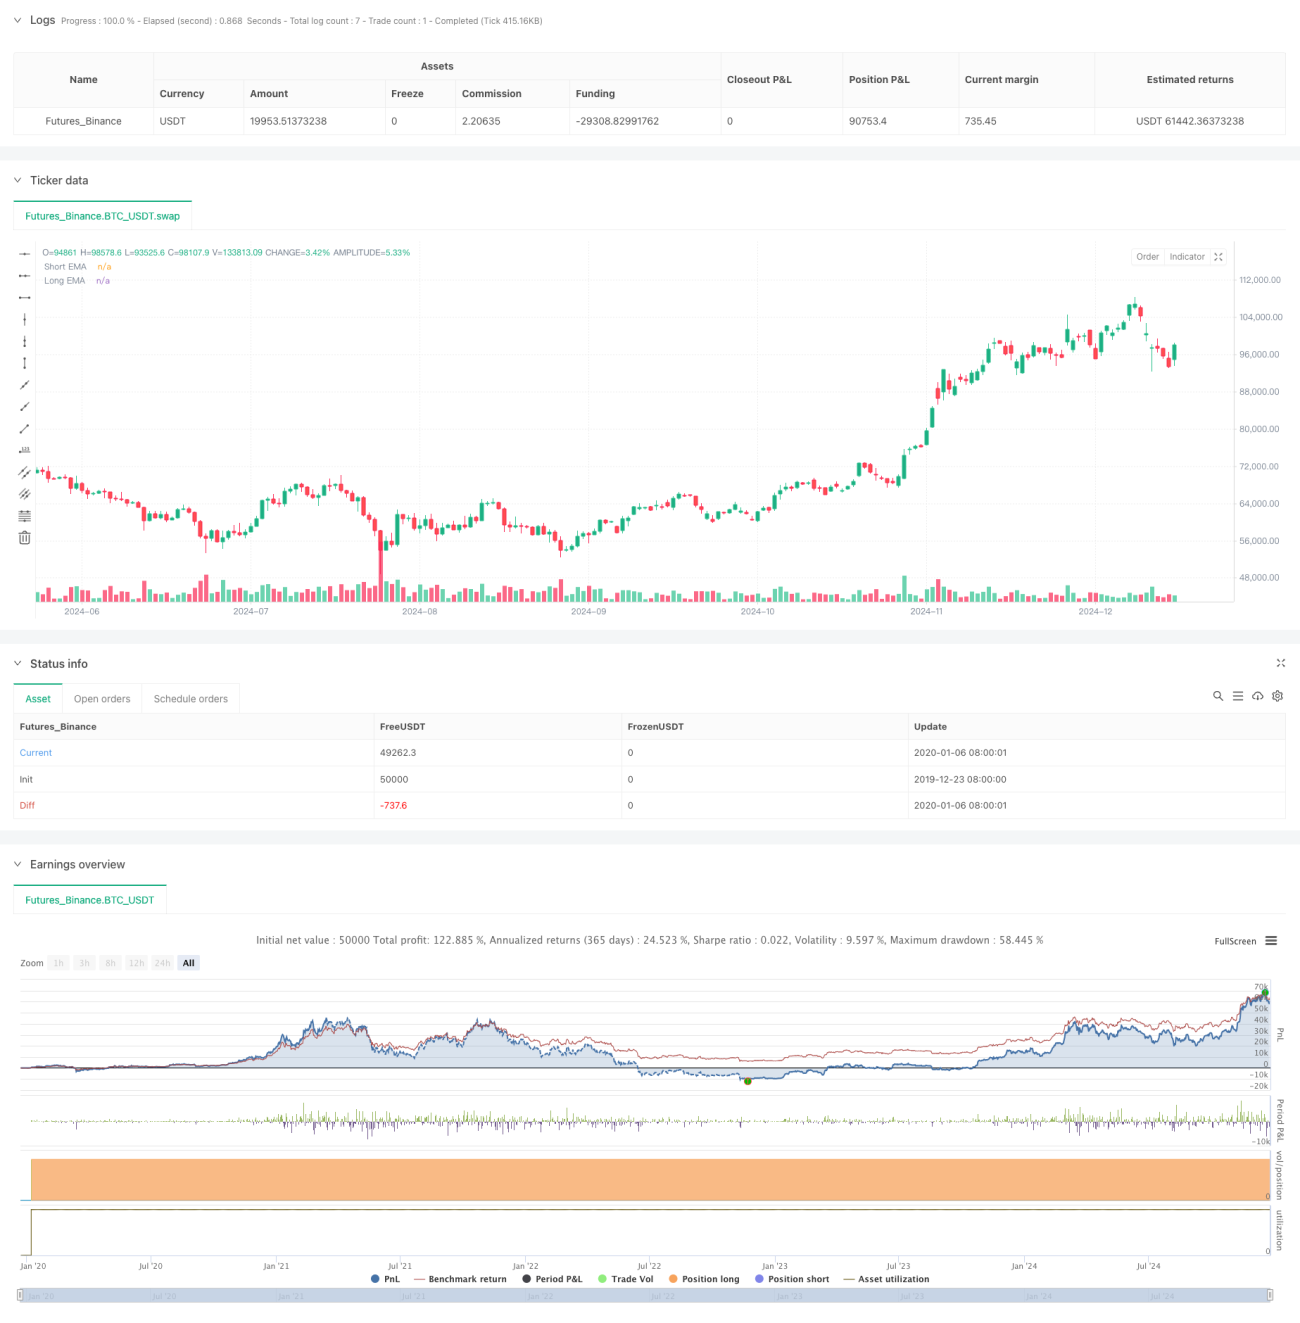
개요
이는 지수 이동 평균선(EMA) 교차와 상대 강도 지수(RSI) 확인을 기반으로 하는 추세 추종 전략입니다. 이 전략은 단기 및 장기 EMA의 교차 신호를 RSI 모멘텀 확인과 결합하고, 백분율 손절매 메커니즘을 통합하여 시장 추세의 중요한 전환점을 포착하고 위험을 통제하는 것을 목표로 합니다. 전략의 핵심은 기술 지표의 시너지 효과를 통해 거래 보안을 보장하는 동시에 거래의 정확성과 신뢰성을 높이는 것입니다.
전략 원칙
이 전략은 이중 기술 지표 필터링 메커니즘을 사용합니다. 첫째, 단기 EMA(9기간)와 장기 EMA(21기간)의 교차를 통해 잠재적인 추세 전환점을 식별합니다. 단기 EMA가 장기 EMA를 상향 교차하고 RSI 값이 설정 레벨보다 높을 경우 시스템은 롱 신호를 생성하고, 단기 EMA가 장기 EMA를 하향 교차하고 RSI 값이 설정 레벨보다 낮을 경우 설정된 수준보다 낮으면 시스템은 짧은 신호를 생성합니다. 동시에 이 전략은 백분율 기반 손절매 메커니즘을 도입하여 각 거래에 대해 동적 손절매 가격을 설정하여 하락 위험을 효과적으로 통제합니다.
전략적 이점
- 이중 기술 지표 확인 메커니즘은 거래 신호의 신뢰성을 크게 향상시키고 잘못된 신호를 줄여줍니다.
- 동적 손절매 메커니즘은 각 거래의 위험 노출을 효과적으로 제어할 수 있습니다.
- 매개변수는 매우 조정 가능하며, 거래자는 다양한 시장 환경에 따라 유연하게 조정할 수 있습니다.
- 전략 논리는 명확하고 이해하기 쉬우며 구현하기 쉽습니다.
- 시각적 신호 표시와 손절선으로 거래 결정을 보다 직관적으로 내릴 수 있습니다.
전략적 위험
- 변동성이 큰 시장에서는 빈번한 거래 신호가 생성되어 거래 비용이 증가할 수 있습니다.
- EMA는 지연성 지표이기 때문에 변동성이 큰 시장에서는 신속하게 반응하지 못할 수 있습니다.
- RSI 확인 메커니즘은 특정 시장 상황에서 중요한 추세 시작점을 놓칠 수 있습니다.
- 변동성이 큰 시장에서는 고정 비율 정지가 너무 엄격하거나 너무 느슨할 수 있습니다.
전략 최적화 방향
- 손절매 비율을 동적으로 조정하여 위험 관리를 보다 적응 가능하게 만드는 변동성 지표 도입
- 약한 추세 시장에서 잦은 거래를 피하기 위해 추세 강도 필터 추가
- 신호 품질을 개선하기 위한 추가 확인 메커니즘으로 볼륨 지표를 통합합니다.
- 이미 발생한 수익을 보다 잘 보호하기 위해 이동식 손절매 메커니즘을 추가했습니다.
- 시장 환경 분류를 도입하고 다양한 시장 조건에서 다양한 매개변수 설정을 사용하는 것을 고려하십시오.
요약하다
이 전략은 이동 평균 시스템과 모멘텀 지표를 결합하여 완전한 추세 추적 거래 시스템을 구축합니다. 이 전략의 주요 장점은 신뢰할 수 있는 신호 확인 메커니즘과 완벽한 위험 관리 시스템에 있습니다. 몇 가지 본질적인 한계는 있지만, 제안된 최적화 방향을 통해 전략의 전반적인 성능이 더욱 향상될 것으로 기대됩니다. 이는 중장기 추세 트레이더에게 적합한 강력한 전략 프레임워크입니다.
Source
Pine
Strategy parameters
Related strategies
Comment
All comments (0)
No data
- 1