
개요
이 전략은 슈퍼트렌드 지표와 카우프만 적응형 이동 평균(KAMA)을 결합한 추세 추종 거래 시스템입니다. 이 전략은 시장 추세의 변화를 역동적으로 파악하고, 상승 추세에서 장기적 기회를 찾으며, 유연한 손절매 메커니즘을 사용하여 위험을 통제합니다. 이 전략의 핵심 아이디어는 Supertrend 지표의 추세 방향 판단 능력과 KAMA 지표의 시장 변동에 대한 적응 특성을 결합하여 시장 상승 추세에서 롱 포지션을 확립하는 것입니다.
전략 원칙
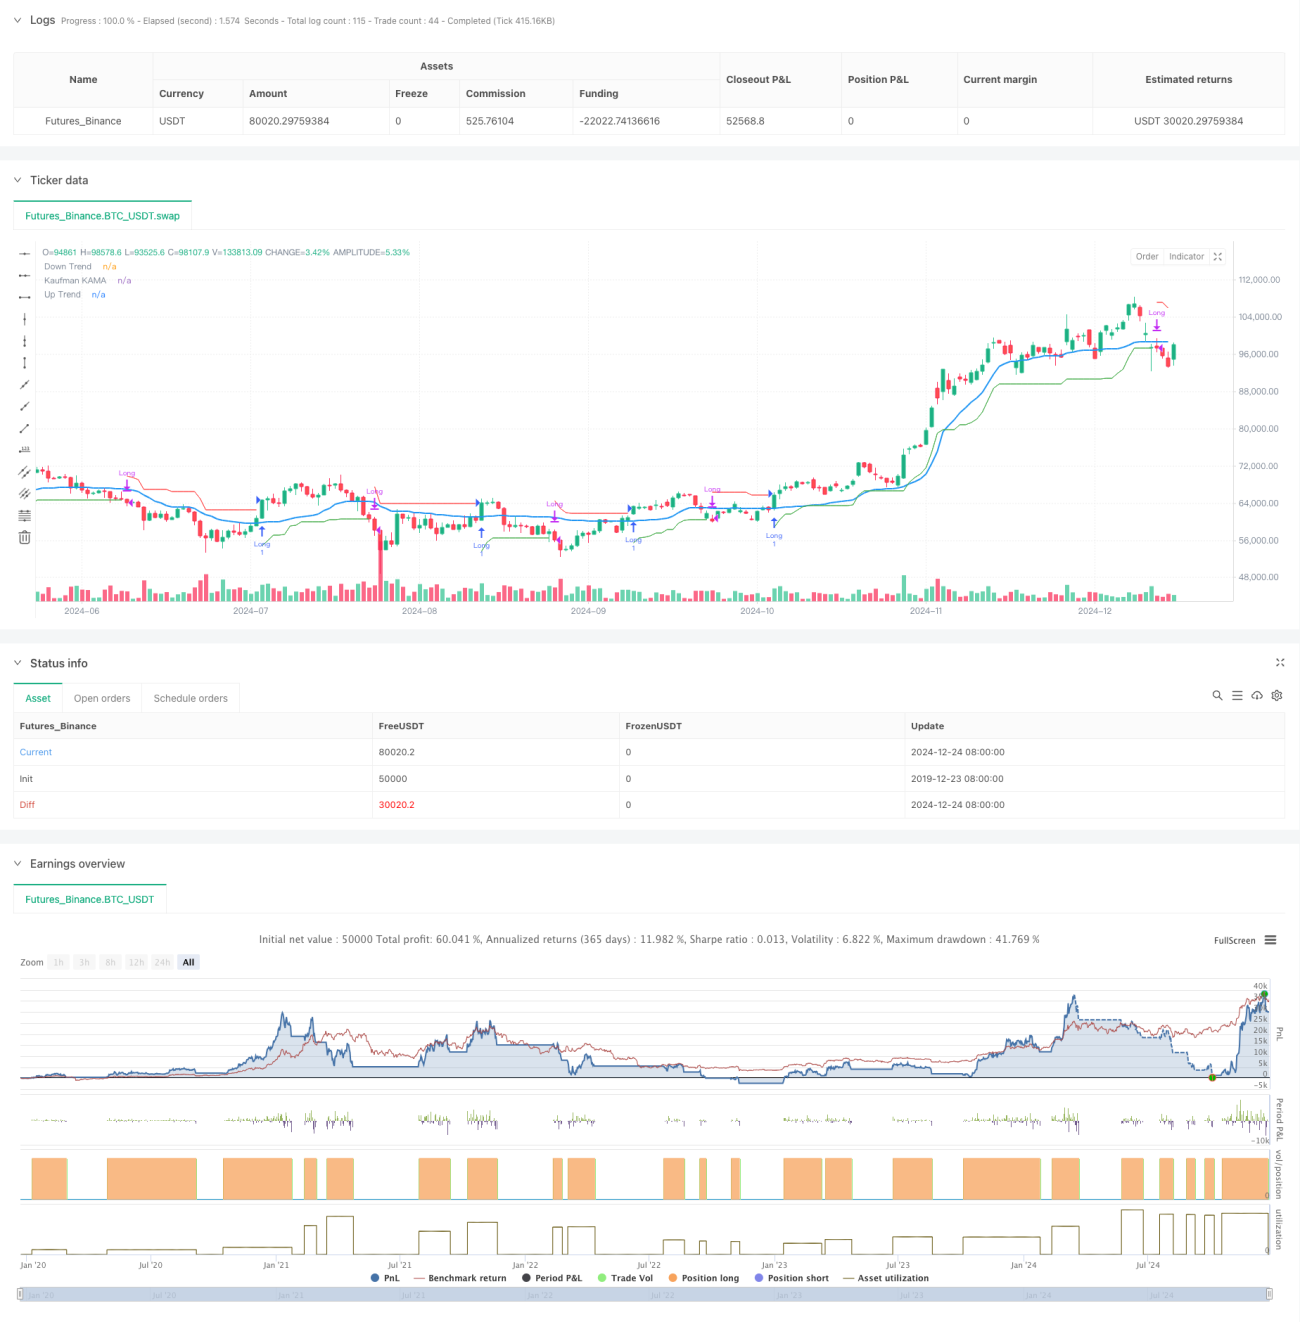
이 전략은 이중 기술 지표 확인 시스템을 사용합니다. 첫째, Supertrend 지표는 ATR과 사용자 정의 계수를 통해 추세 방향을 계산합니다. 지표 선이 가격 아래에 있으면 상승 추세를 나타냅니다. 두 번째로, KAMA 지표는 적응적 메커니즘을 통해 이동평균선의 민감도를 조절하는데, 이는 다양한 시장 환경에 더 잘 적응할 수 있습니다. 진입 신호는 동시에 두 가지 조건을 충족해야 합니다. 슈퍼트렌드는 상승 추세를 나타내고, 가격은 KAMA 선 위에 있습니다. 마찬가지로, 종료 신호에도 두 번의 확인이 필요합니다. 즉, 슈퍼트렌드가 하락세로 바뀌고 가격이 KAMA 선 아래로 떨어지는 것입니다. 이러한 이중 확인 메커니즘은 잘못된 신호의 영향을 효과적으로 줄여줍니다.
전략적 이점
- 신호 신뢰성 향상을 위한 이중 기술 지표 확인 메커니즘 채택
- KAMA 지표는 적응적 특성을 지니고 있어 시장 변동에 따라 민감도를 조절할 수 있습니다.
- Supertrend 지표는 추세 방향을 명확하게 나타냅니다.
- 완벽한 손절매 메커니즘을 갖추고 있어 리스크를 효과적으로 통제할 수 있습니다.
- 전략 논리는 명확하고 매개변수는 매우 조정 가능합니다.
- 진입 및 종료 신호는 명확하고 실행하기 쉽습니다.
전략적 위험
- 변동성이 큰 시장에서는 거래 신호가 자주 발생하여 거래 비용이 증가할 수 있습니다.
- 트렌드 반전 초기 단계에 지연이 발생할 수 있으며, 이는 손절매 효과에 영향을 미칠 수 있습니다.
- 부적절한 매개변수 선택은 과민성이나 무감각을 초래할 수 있습니다.
- 시장이 급격하게 변동할 경우 큰 슬리피지에 직면할 수 있습니다.
- 거래 비용과 미끄러짐은 전략의 전체 수익에 영향을 미칠 수 있습니다.
전략 최적화 방향
- 변동성이 높은 기간 동안 매개변수를 조정하거나 거래를 중단하기 위한 변동성 필터 메커니즘 도입
- 보조 확인으로 볼륨 표시기 추가
- 손절매 메커니즘을 최적화하고 트레일링 손절매 사용을 고려하세요.
- 전략에 적용 가능한 시장 환경 판단력 향상
- 특정 기간 동안의 거래를 방지하기 위해 시간 필터링을 추가합니다.
- 적응형 매개변수 최적화 시스템 개발
요약하다
이 전략은 두 가지 기술 지표인 Supertrend와 KAMA를 결합하여 강력한 추세 추종 거래 시스템을 구축합니다. 이 전략의 주요 장점은 적응성과 위험 관리 능력이며, 이중 확인 메커니즘을 통해 거래 신호의 신뢰성이 향상됩니다. 변동성이 큰 시장에서는 몇 가지 어려움이 있을 수 있지만, 적절한 매개변수 설정과 최적화 방향의 구현을 통해 전략의 전반적인 성과를 더욱 개선할 수 있습니다. 이 전략은 특히 중기 및 장기 추세 거래에 적합하며 추세가 명확한 시장 환경에서 더 좋은 성과를 거두고 있습니다.
/*backtest
start: 2019-12-23 08:00:00
end: 2024-12-25 08:00:00
period: 1d
basePeriod: 1d
exchanges: [{"eid":"Futures_Binance","currency":"BTC_USDT"}]
*/

//@version=6
strategy("Supertrend + KAMA Long Strategy", overlay=true, commission_type=strategy.commission.percent, commission_value=0.1, slippage=3)

// User-defined inputs for date range- 1