Triple Supertrend 지표와 지수 이동 평균 추세 추종 양적 거래 전략

EMA ATR
생성 날짜: 2024-12-27 15:56:53 마지막으로 수정됨: 2024-12-27 15:56:53
복사: 0 클릭수: 539
avatar of ChaoZhang ChaoZhang
1
집중하다
1617
수행원

Triple Supertrend 지표와 지수 이동 평균 추세 추종 양적 거래 전략

개요

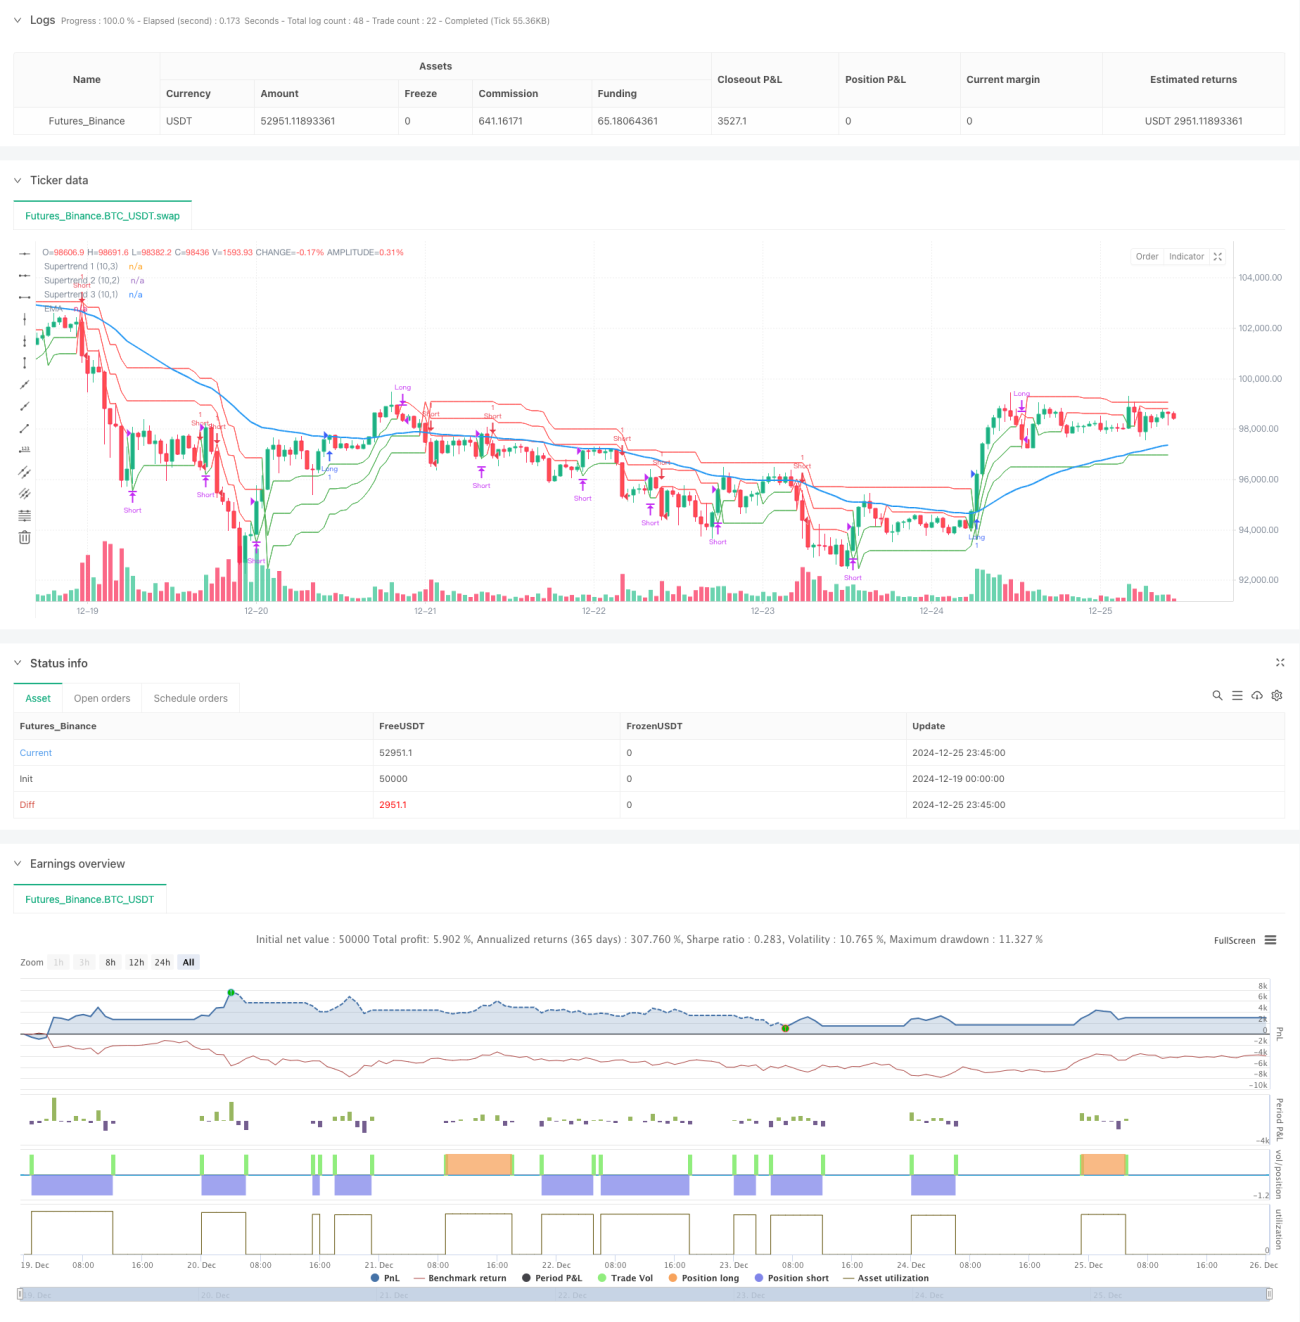
이 전략은 트리플 슈퍼트렌드 지표와 지수 이동 평균(EMA)을 결합한 추세 추종 전략입니다. 시장 동향을 포착하기 위해 민감도가 다른 3개의 슈퍼트렌드선과 1개의 EMA를 설정함으로써 추세에 대한 다차원적 확인이 가능합니다. 이 전략은 ATR(평균 진폭)을 사용하여 동적 지지/저항 수준을 계산하고, 가격과 각 선 간의 위치 관계에 따라 추세 방향과 거래 신호를 결정합니다.

전략 원칙

이 전략에는 주로 다음과 같은 핵심 구성 요소가 포함됩니다.

  1. 50주기 EMA는 전반적인 추세 방향을 결정하는 데 사용됩니다. EMA 위의 가격은 상승 추세로 간주되고 그 반대의 경우도 마찬가지입니다.
  2. 3개의 초전위선은 각각 3.0, 2.0 및 1.0의 배수를 적용한 10주기 ATR을 기준으로 계산되며, 이에 따라 감도가 감소합니다.
  3. 진입 신호: 가격이 EMA 위에 있고 3개의 슈퍼트렌드선이 모두 강세 신호를 보이면 롱 포지션을 오픈합니다. 가격이 EMA 아래에 있고 3개의 슈퍼트렌드선이 모두 약세 신호를 보이면 숏 포지션을 오픈합니다.
  4. 종료 신호: 세 번째 슈퍼트렌드선(가장 민감하지 않음)이 반전되면 포지션을 종료합니다.

전략적 이점

  1. 다중 확인 메커니즘은 신호의 신뢰성을 향상시키고 거짓 신호를 효과적으로 줄일 수 있습니다.
  2. 안정성을 잃지 않으면서도 신속하게 대응할 수 있는 단기 및 장기 추세 지표를 결합합니다.
  3. 동적 손절매 설정은 시장 변동성에 따라 자동으로 조정될 수 있습니다.
  4. 전략적 논리는 명확하고 매개변수는 매우 조정 가능합니다.
  5. 다양한 시장 주기에 적용 가능하며 보편성이 좋습니다.

전략적 위험

  1. 변동성이 큰 시장에서는 거래가 잦아지고 거래 비용이 증가할 수 있습니다. 해결책: 신호 필터를 추가하거나 이동 평균 기간을 연장할 수 있습니다.

  2. 추세 반전의 초기 단계에는 지연이 있을 수 있습니다. 대책: 판단을 돕기 위해 모멘텀 지표를 도입할 수 있습니다.

  3. 다중 확인 메커니즘으로 인해 일부 수익 창출 기회를 놓칠 수 있습니다. 대책: 확인 조건은 시장 특성에 따라 적절히 조정될 수 있습니다.

전략 최적화 방향

  1. 보조 확인으로 볼륨 지표를 도입합니다.
  2. 시장 상황에 따라 매개변수를 동적으로 조정하는 적응형 매개변수 메커니즘을 개발합니다.
  3. 변동성 필터를 추가하여 변동성이 높은 기간 동안 포지션을 조정합니다.
  4. 손절매 메커니즘을 최적화하려면 이동 손절매를 사용하는 것을 고려해 볼 수 있습니다.
  5. 되돌림 제어 모듈을 추가하고 최대 되돌림 한도를 설정합니다.

요약하다

이는 엄격한 논리와 강력한 안정성을 갖춘 추세 추적 전략입니다. 다양한 기술 지표를 조화롭게 활용함으로써 신호의 신뢰성이 보장되고, 우수한 위험 관리 능력도 확보됩니다. 전략의 매개변수는 매우 조정 가능하며 다양한 시장 상황에 따라 최적화할 수 있습니다. 어느 정도 지연은 있지만, 적절한 최적화를 통해 위험과 수익 사이에 적절한 균형을 이룰 수 있습니다.

전략 소스 코드
/*backtest
start: 2024-12-19 00:00:00
end: 2024-12-26 00:00:00
period: 45m
basePeriod: 45m
exchanges: [{"eid":"Futures_Binance","currency":"BTC_USDT"}]
*/

//@version=5
strategy("Supertrend EMA Strategy", overlay=true)

// Input Parameters
ema_length = input(50, title="EMA Length")
supertrend_atr_period = input(10, title="ATR Period")
supertrend_multiplier1 = input.float(3.0, title="Supertrend Multiplier 1")
supertrend_multiplier2 = input.float(2.0, title="Supertrend Multiplier 2")
supertrend_multiplier3 = input.float(1.0, title="Supertrend Multiplier 3")

// Calculations
emaValue = ta.ema(close, ema_length)

[supertrend1, SupertrendDirection1] = ta.supertrend(supertrend_multiplier1, supertrend_atr_period)
[supertrend2, SupertrendDirection2] = ta.supertrend(supertrend_multiplier2, supertrend_atr_period)
[supertrend3, SupertrendDirection3] = ta.supertrend(supertrend_multiplier3, supertrend_atr_period)

// Plot Indicators
plot(emaValue, title="EMA", color=color.blue, linewidth=2)
plot(supertrend1, title="Supertrend 1 (10,3)", color=(SupertrendDirection1 == -1 ? color.green : color.red), linewidth=1, style=plot.style_line)
plot(supertrend2, title="Supertrend 2 (10,2)", color=(SupertrendDirection2 == -1 ? color.green : color.red), linewidth=1, style=plot.style_line)
plot(supertrend3, title="Supertrend 3 (10,1)", color=(SupertrendDirection3 == -1 ? color.green : color.red), linewidth=1, style=plot.style_line)

// Entry Conditions
long_condition = (SupertrendDirection1 == -1 and SupertrendDirection2 == -1 and SupertrendDirection3 == -1 and close > emaValue)
short_condition = (SupertrendDirection1 == 1 and SupertrendDirection2 == 1 and SupertrendDirection3 == 1 and close < emaValue)

// Exit Conditions
long_exit = (SupertrendDirection3 == 1)
short_exit = (SupertrendDirection3 == -1)

// Execute Strategy
if (long_condition)
    strategy.entry("Long", strategy.long)
if (short_condition)
    strategy.entry("Short", strategy.short)

if (long_exit)
    strategy.close("Long")
if (short_exit)
    strategy.close("Short")