
이 전략은 15분 기간의 고빈도 거래 전략입니다. 이 전략은 지수 이동 평균(EMA), 상대 강도 지수(RSI), 평균 방향 지수(ADX) 및 평균 진폭 범위(ATR)를 포함한 여러 기술 지표를 결합하여 이러한 지표의 시너지 효과를 통해 거래 신호를 달성합니다. 정확한 캡처 그리고 역동적인 위험 관리. 이 전략은 명확한 시각적 디자인을 채택하여 트레이더가 시장 상황과 거래 신호를 실시간으로 쉽게 모니터링할 수 있도록 해줍니다.
이 전략의 핵심 논리는 빠른 EMA(9개 기간)와 느린 EMA(21개 기간)의 교차를 기반으로 거래 신호를 생성하는 것입니다. RSI(14기간)는 매도 과열 영역을 필터링하는 데 사용되고, ADX(14기간)는 추세 강도를 확인하는 데 사용되며, ATR(14기간)은 손절매 및 수익 목표를 동적으로 설정하는 데 사용됩니다. 여러 가지 기술 지표를 결합하면 거래 신호의 신뢰성이 보장됩니다. 진입 조건은 다음과 같습니다. 롱 - 빠른 EMA가 느린 EMA 위로 교차하고 RSI가 70 미만이고 ADX가 20 이상인 경우, 숏 - 빠른 EMA가 느린 EMA 아래로 교차하고 RSI가 30 이상이고 ADX가 20 이상인 경우 20. 종료는 ATR을 기반으로 동적 손절매 및 수익 목표 설정을 사용합니다.
이 전략은 여러 기술 지표의 시너지 효과를 통해 고빈도 거래에서 신호 포착과 위험 제어 간의 균형을 달성합니다. 명확한 시각적 디자인과 완벽한 자동화 지원으로 더욱 실용적입니다. 지속적인 최적화와 위험 관리 개선을 통해 이 전략은 다양한 시장 환경에서도 안정적인 성과를 유지할 것으로 기대됩니다. 특정 위험은 존재하지만, 이러한 위험은 합리적인 매개변수 설정과 위험 관리 조치를 통해 통제할 수 있습니다. 전략을 성공적으로 운영하려면 거래자가 시장을 깊이 이해하고 위험에 지속적으로 집중해야 합니다.
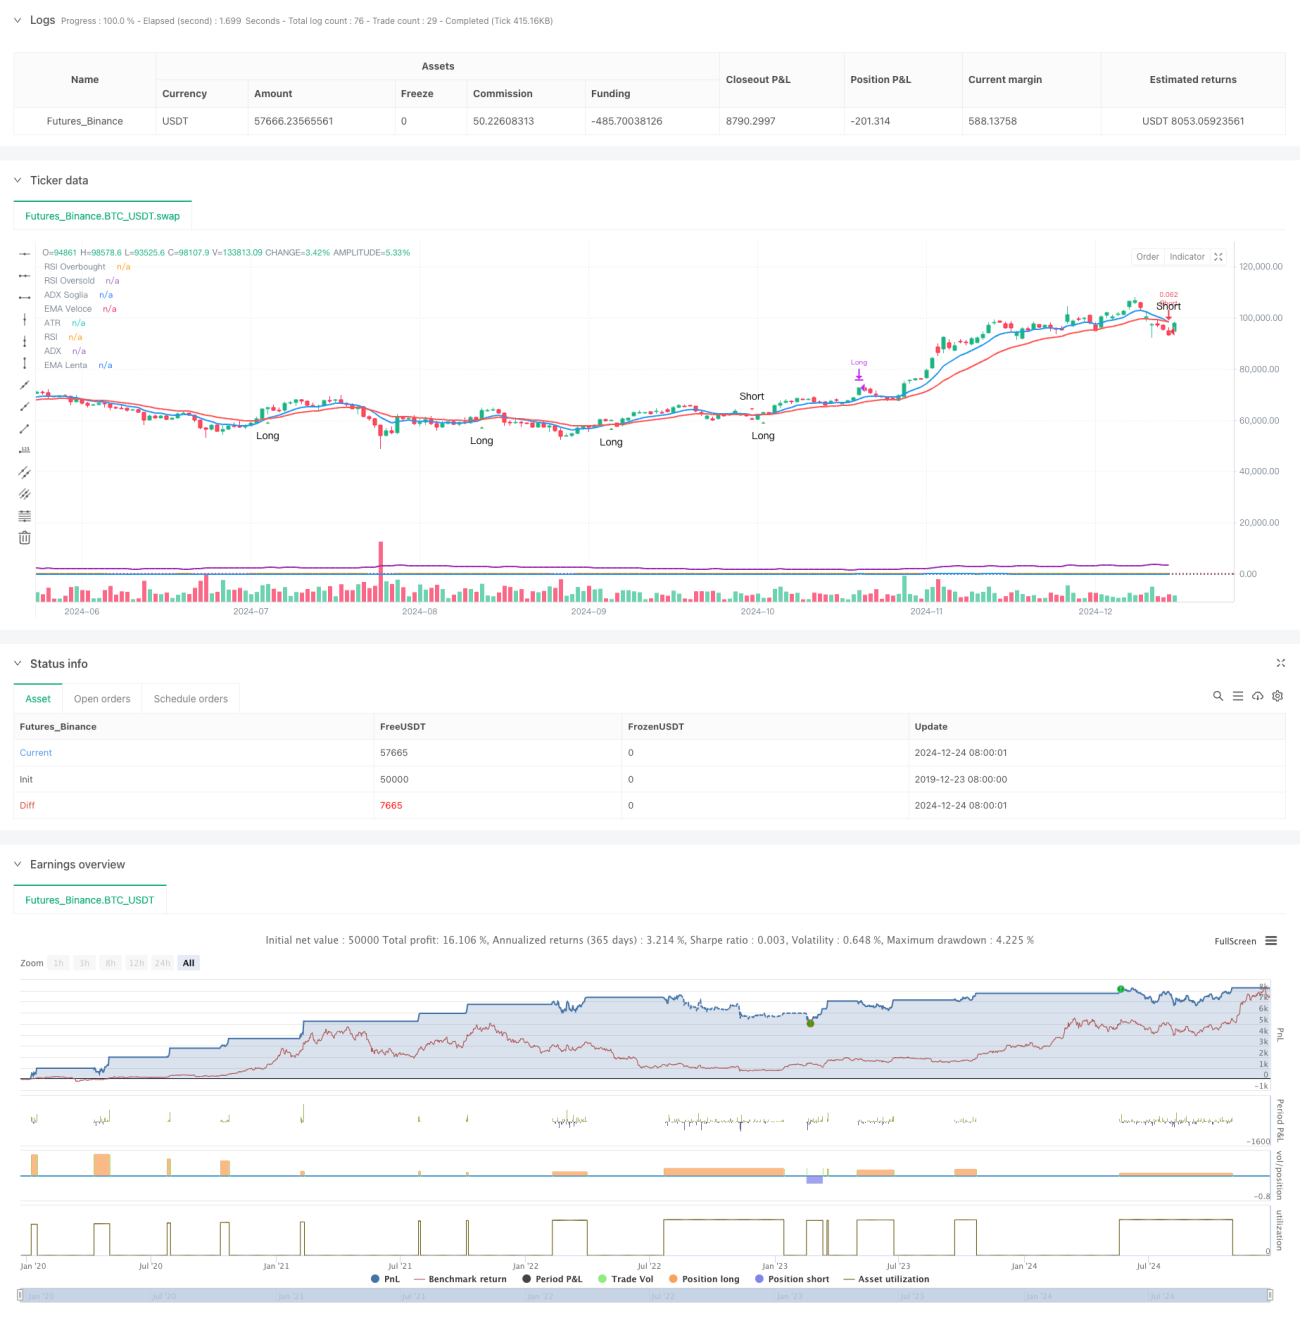
/*backtest
start: 2019-12-23 08:00:00
end: 2024-12-25 08:00:00
period: 1d
basePeriod: 1d
exchanges: [{"eid":"Futures_Binance","currency":"BTC_USDT"}]
*/
//@version=5
strategy("Scalping BTC Ottimizzato - Grafica Chiara", shorttitle="Scalp BTC Opt", overlay=true, default_qty_type=strategy.percent_of_equity, default_qty_value=10)
// === 📊 INPUTS ===
// 📈 Medie Mobili
emaFastLength = input.int(9, title="EMA Veloce", minval=1)
emaSlowLength = input.int(21, title="EMA Lenta", minval=1)
// 💡 RSI
rsiLength = input.int(14, title="RSI Length", minval=1)
rsiOverbought = input.int(70, title="RSI Overbought")
rsiOversold = input.int(30, title="RSI Oversold")
// 📊 ATR (Stop Loss e Take Profit)
atrLength = input.int(14, title="ATR Length", minval=1)
stopATR = input.float(1.5, title="Stop Loss (ATR Multiplo)", step=0.1)
takeProfitATR = input.float(2.0, title="Take Profit (ATR Multiplo)", step=0.1)
// 🔀 ADX
adxLength = input.int(14, title="ADX Length", minval=1)
adxSmoothing = input.int(14, title="ADX Smoothing", minval=1)
adxThreshold = input.int(20, title="Soglia ADX per Trend Forte", minval=1)
// === 📊 CALCOLI PRINCIPALI ===
// 📈 Medie Mobili
emaFast = ta.ema(close, emaFastLength)
emaSlow = ta.ema(close, emaSlowLength)
// 💡 RSI
rsi = ta.rsi(close, rsiLength)
// 📊 ATR
atr = ta.atr(atrLength)
// 🔀 ADX tramite DMI con Smoothing
[adx, diPlus, diMinus] = ta.dmi(adxLength, adxSmoothing)
// === 📊 CONDIZIONI LONG E SHORT ===
// ✅ Long: EMA Veloce incrocia EMA Lenta al rialzo, RSI sotto 70, ADX > 20
longCondition = (ta.crossover(emaFast, emaSlow)) and (rsi < rsiOverbought) and (adx > adxThreshold)
// 🔻 Short: EMA Veloce incrocia EMA Lenta al ribasso, RSI sopra 30, ADX > 20
shortCondition = (ta.crossunder(emaFast, emaSlow)) and (rsi > rsiOversold) and (adx > adxThreshold)
// 📉 Stop Loss e Take Profit Dinamici
longStop = strategy.position_avg_price - (atr * stopATR)
longTarget = strategy.position_avg_price + (atr * takeProfitATR)
shortStop = strategy.position_avg_price + (atr * stopATR)
shortTarget = strategy.position_avg_price - (atr * takeProfitATR)
// === 🚀 INGRESSO E USCITA ===
// 🚦 Ingresso LONG
if (longCondition and strategy.position_size == 0)
strategy.entry("Long", strategy.long)
strategy.exit("TakeProfit/StopLoss Long", stop=longStop, limit=longTarget)
// 🚦 Ingresso SHORT
if (shortCondition and strategy.position_size == 0)
strategy.entry("Short", strategy.short)
strategy.exit("TakeProfit/StopLoss Short", stop=shortStop, limit=shortTarget)
// 🛑 USCITA MANUALE BASATA SU RSI
if (rsi > rsiOverbought and strategy.position_size > 0)
strategy.close("Long", comment="RSI Overbought Exit")
if (rsi < rsiOversold and strategy.position_size < 0)
strategy.close("Short", comment="RSI Oversold Exit")
// === 📊 VISUALIZZAZIONE GRAFICA OTTIMIZZATA ===
// 📈 MEDIE MOBILI ANCORATE ALLE CANDELE
plot(emaFast, title="EMA Veloce", color=color.blue, linewidth=2)
plot(emaSlow, title="EMA Lenta", color=color.red, linewidth=2)
// 📊 SEGNALI VISIVI ANCORATI ALLE CANDELE
plotshape(longCondition, title="Segnale Long", style=shape.triangleup, location=location.belowbar, color=color.green, text="Long", size=size.small)
plotshape(shortCondition, title="Segnale Short", style=shape.triangledown, location=location.abovebar, color=color.red, text="Short", size=size.small)
// 📊 RSI (Pannello Separato)
var float rsiPanel = na
rsiPanel := rsi
plot(rsiPanel, title="RSI", color=color.orange, linewidth=2)
hline(rsiOverbought, "RSI Overbought", color=color.red, linestyle=hline.style_dotted)
hline(rsiOversold, "RSI Oversold", color=color.green, linestyle=hline.style_dotted)
// 📊 ADX (Pannello Separato)
var float adxPanel = na
adxPanel := adx
plot(adxPanel, title="ADX", color=color.blue, linewidth=2)
hline(adxThreshold, "ADX Soglia", color=color.gray, linestyle=hline.style_dotted)
// 📊 ATR (Pannello Separato)
var float atrPanel = na
atrPanel := atr
plot(atrPanel, title="ATR", color=color.purple, linewidth=2)
// 🔔 ALERT
alertcondition(longCondition, title="Segnale Long", message="Entra Long Manualmente!")
alertcondition(shortCondition, title="Segnale Short", message="Entra Short Manualmente!")