
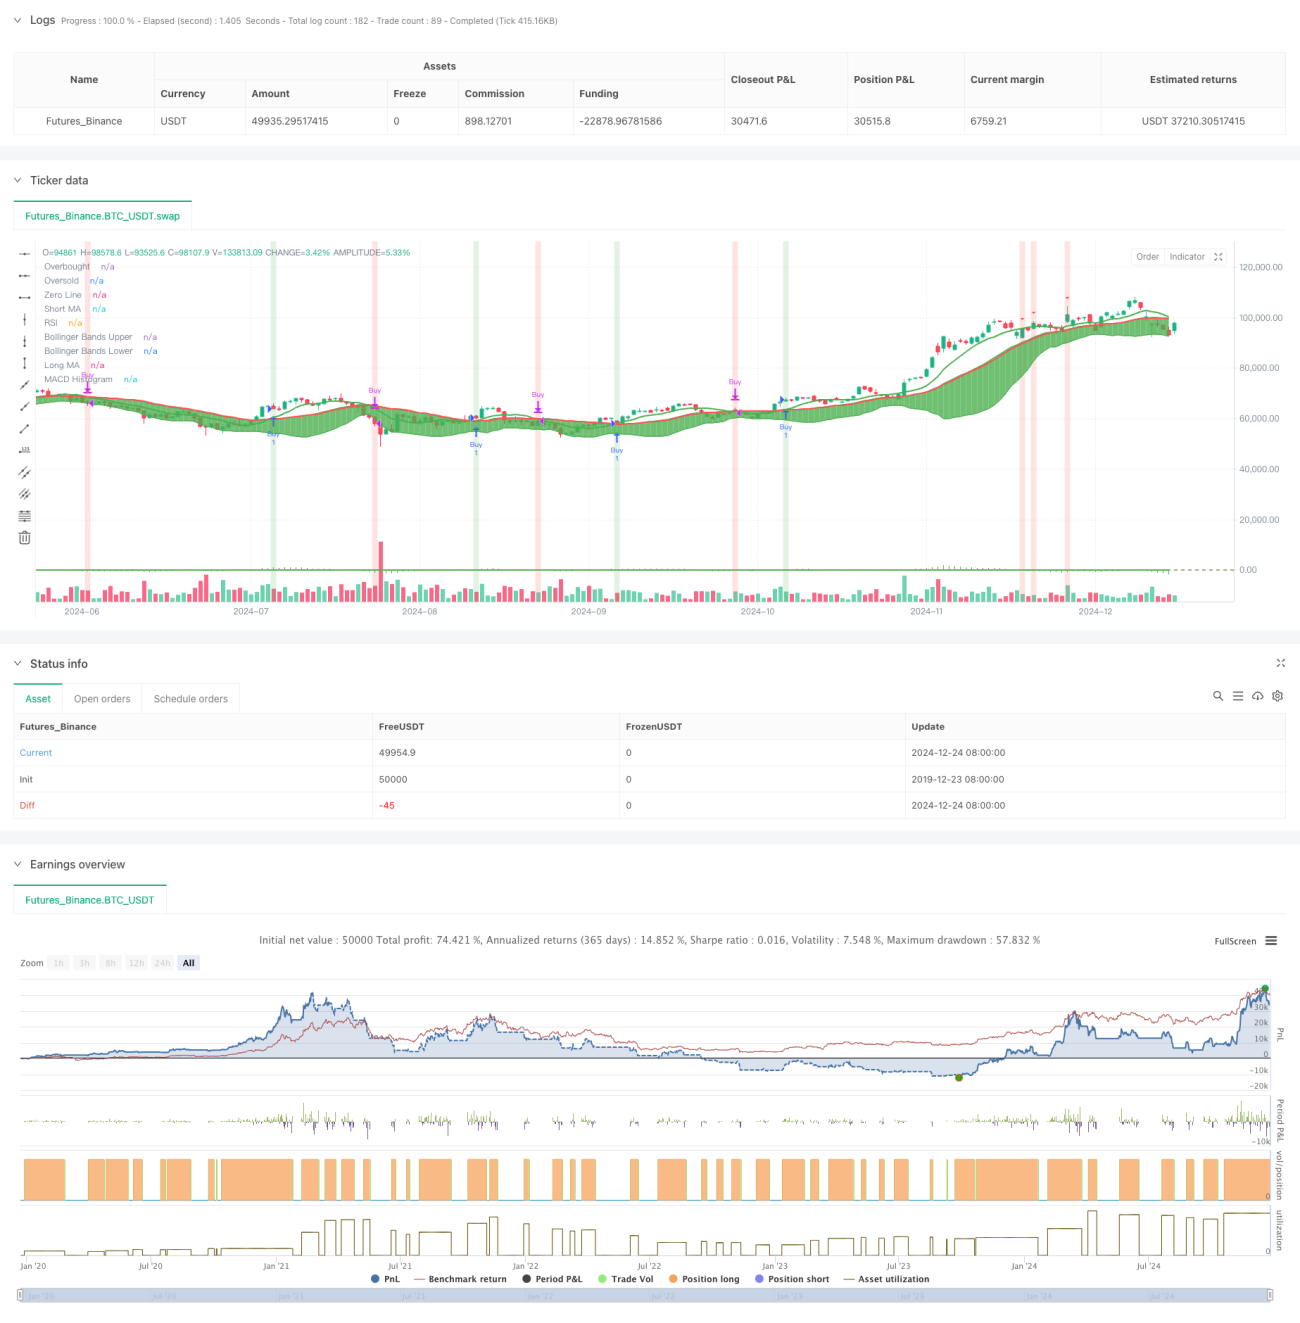
이 전략은 이동평균선(MA), 상대강도지수(RSI), 이동평균수렴발산지수(MACD), 볼린저 밴드(BB)를 포함한 여러 가지 고전적 기술 지표를 결합한 포괄적인 거래 시스템입니다. 이 시스템은 이러한 지표의 조정된 협력을 활용하여 시장에서 더 정확한 매수 및 매도 신호를 찾아 거래 성공률을 향상시킵니다.
본 전략은 다층 신호 검증 메커니즘을 채택하는데, 이는 주로 다음과 같은 측면을 포함합니다.
시스템은 다음 조건에서 거래 신호를 생성합니다.
이는 여러 기술 지표의 시너지 효과를 통해 거래 신호를 제공하는 잘 설계된 다차원 거래 전략 시스템입니다. 이 전략의 주요 장점은 포괄적인 분석 프레임워크와 엄격한 신호 확인 메커니즘에 있지만, 매개변수 최적화 및 시장 환경에 대한 적응성과 같은 문제에도 주의를 기울여야 합니다. 추천된 최적화 방향을 통해 볼 때, 이 전략은 아직도 개선의 여지가 많이 있습니다.
/*backtest
start: 2019-12-23 08:00:00
end: 2024-12-25 08:00:00
period: 1d
basePeriod: 1d
exchanges: [{"eid":"Futures_Binance","currency":"BTC_USDT"}]
*/
//@version=5
strategy("Ultimate Buy/Sell Indicator", overlay=true)
// Inputs for Moving Averages
shortMaLength = input.int(9, title="Short MA Length", minval=1)
longMaLength = input.int(21, title="Long MA Length", minval=1)
// Inputs for RSI
rsiLength = input.int(14, title="RSI Length", minval=1)
rsiOverbought = input.int(70, title="RSI Overbought Level", minval=1, maxval=100)
rsiOversold = input.int(30, title="RSI Oversold Level", minval=1, maxval=100)
// Inputs for MACD
macdShortLength = input.int(12, title="MACD Short EMA Length", minval=1)
macdLongLength = input.int(26, title="MACD Long EMA Length", minval=1)
macdSignalSmoothing = input.int(9, title="MACD Signal Smoothing", minval=1)
// Inputs for Bollinger Bands
bbLength = input.int(20, title="Bollinger Bands Length", minval=1)
bbMultiplier = input.float(2.0, title="Bollinger Bands Multiplier", minval=0.1)
// Calculate Moving Averages
shortMa = ta.sma(close, shortMaLength)
longMa = ta.sma(close, longMaLength)
// Calculate RSI
rsi = ta.rsi(close, rsiLength)
// Calculate MACD
[macdLine, signalLine, _] = ta.macd(close, macdShortLength, macdLongLength, macdSignalSmoothing)
macdHist = macdLine - signalLine
// Calculate Bollinger Bands
[bbUpper, bbBasis, bbLower] = ta.bb(close, bbLength, bbMultiplier)
// Define colors
colorPrimary = color.new(color.green, 0)
colorSecondary = color.new(color.red, 0)
colorBackgroundBuy = color.new(color.green, 80)
colorBackgroundSell = color.new(color.red, 80)
colorTextBuy = color.new(color.green, 0)
colorTextSell = color.new(color.red, 0)
// Plot Moving Averages
plot(shortMa, color=colorPrimary, linewidth=2, title="Short MA")
plot(longMa, color=colorSecondary, linewidth=2, title="Long MA")
// Plot Bollinger Bands
bbUpperLine = plot(bbUpper, color=colorPrimary, linewidth=1, title="Bollinger Bands Upper")
bbLowerLine = plot(bbLower, color=colorPrimary, linewidth=1, title="Bollinger Bands Lower")
fill(bbUpperLine, bbLowerLine, color=color.new(colorPrimary, 90))
// Buy/Sell Conditions based on MA cross
buySignal = ta.crossover(shortMa, longMa)
sellSignal = ta.crossunder(shortMa, longMa)
// Execute Buy/Sell Orders
if buySignal
strategy.entry("Buy", strategy.long, 1)
strategy.close("Sell", qty_percent=1) // Close all positions when selling
if sellSignal
strategy.close("Sell", qty_percent=1) // Close all positions when selling
strategy.close("Buy") // Close any remaining buy positions
// Plot Buy/Sell Signals for MA crossovers
plotshape(series=buySignal, location=location.belowbar, color=colorTextBuy, style=shape.triangleup, size=size.small, title="Buy Signal")
plotshape(series=sellSignal, location=location.abovebar, color=colorTextSell, style=shape.triangledown, size=size.small, title="Sell Signal")
// Background Color based on Buy/Sell Signal for MA crossovers
bgcolor(buySignal ? colorBackgroundBuy : na, title="Buy Signal Background")
bgcolor(sellSignal ? colorBackgroundSell : na, title="Sell Signal Background")
// Plot RSI with Overbought/Oversold Levels
hline(rsiOverbought, "Overbought", color=colorSecondary, linestyle=hline.style_dashed, linewidth=1)
hline(rsiOversold, "Oversold", color=colorPrimary, linestyle=hline.style_dashed, linewidth=1)
plot(rsi, color=colorPrimary, linewidth=2, title="RSI")
// Plot MACD Histogram
plot(macdHist, color=colorPrimary, style=plot.style_histogram, title="MACD Histogram", linewidth=2)
hline(0, "Zero Line", color=color.new(color.gray, 80))
// Additional Buy/Sell Conditions based on RSI, MACD, and Bollinger Bands
additionalBuySignal = rsi < rsiOversold and macdHist > 0 and close < bbLower
additionalSellSignal = rsi > rsiOverbought and macdHist < 0 and close > bbUpper
// Plot Additional Buy/Sell Signals
plotshape(series=additionalBuySignal and not buySignal, location=location.belowbar, color=colorTextBuy, style=shape.triangleup, size=size.small, title="Additional Buy Signal")
plotshape(series=additionalSellSignal and not sellSignal, location=location.abovebar, color=colorTextSell, style=shape.triangledown, size=size.small, title="Additional Sell Signal")
// Background Color based on Additional Buy/Sell Signal
bgcolor(additionalBuySignal and not buySignal ? colorBackgroundBuy : na, title="Additional Buy Signal Background")
bgcolor(additionalSellSignal and not sellSignal ? colorBackgroundSell : na, title="Additional Sell Signal Background")