고급 양적 추세 추적 및 클라우드 차트 반전 복합 거래 전략

1
Follow
1781
Followers
개요
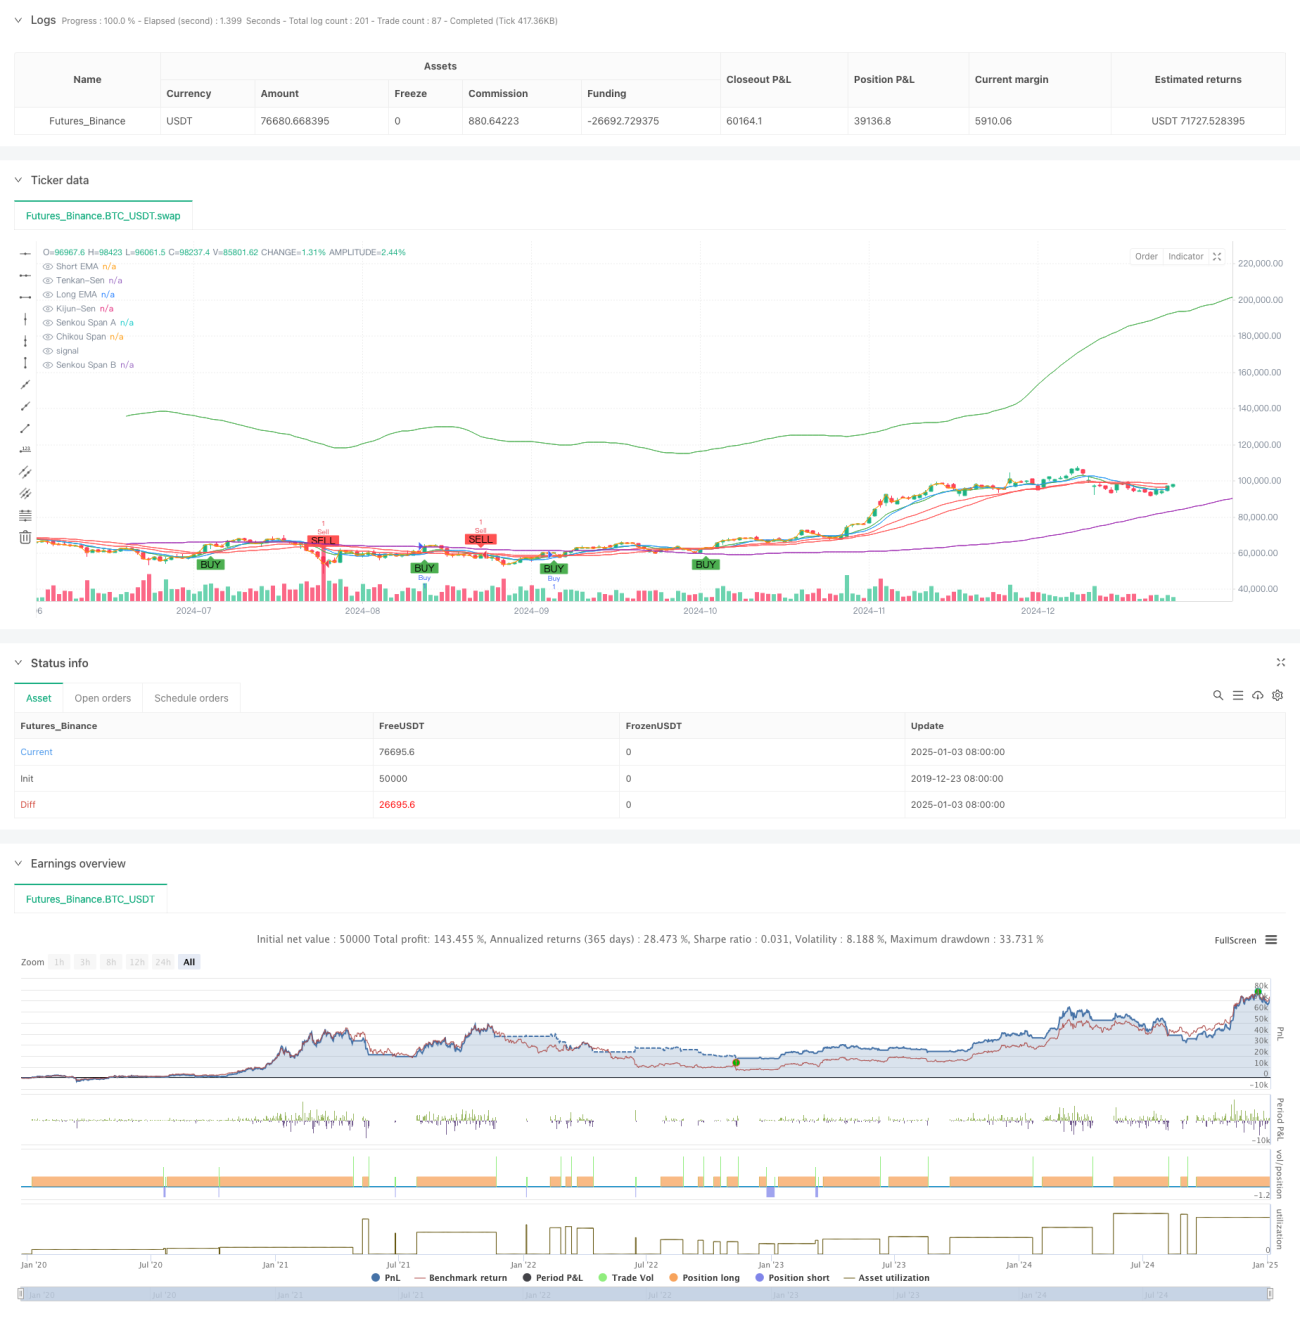
이 전략은 지수 이동 평균(EMA) 교차와 이치모쿠 클라우드를 결합한 복합 거래 시스템입니다. EMA 크로스오버는 주로 트렌드 시작 신호를 포착하고 매수 기회를 확인하는 데 사용되는 반면, 이치모쿠 클라우드는 시장 전환점을 식별하고 매도 기회를 결정하는 데 사용됩니다. 다차원적 기술 지표의 조정된 협력을 통해 이러한 전략은 추세를 효과적으로 파악할 수 있을 뿐만 아니라 적절한 시기에 위험을 피할 수도 있습니다.
전략 원칙
전략 운영 메커니즘은 주로 두 가지 핵심 부분으로 구성됩니다.
- EMA 교차 매수 신호: 단기(9일)와 장기(21일) 지수 이동 평균의 교차를 사용하여 추세 방향을 확인하세요. 단기 EMA가 장기 EMA를 위로 교차하면 단기 모멘텀이 강화되고 매수 신호가 생성됨을 나타냅니다.
- 이치모쿠 클라우드 차트 매도 신호: 가격과 클라우드 차트 사이의 위치 관계와 클라우드 차트의 내부 구조를 통해 추세 반전을 확인합니다. 가격이 클라우드 차트의 하단 경계선 아래로 떨어지거나 선행 밴드 A가 선행 밴드 B 아래로 떨어지면 매도 신호가 발생합니다. 이 전략은 손절매와 이익 실현 메커니즘도 설정하는데, 손절매는 1.5%로, 이익 목표는 3%로 설정됩니다.
전략적 이점
- 다차원 신호 확인: EMA 크로스오버와 이치모쿠 클라우드 차트를 조화롭게 활용함으로써 거래 신호의 신뢰성을 다양한 각도에서 검증할 수 있습니다.
- 완벽한 위험 관리: 고정된 비율의 손절매 및 수익 목표를 설정하면 각 거래의 위험을 효과적으로 관리할 수 있습니다.
- 강력한 추세 파악 능력: EMA 크로스오버는 적절한 시기에 추세의 시작을 포착할 수 있고, 이치모쿠 클라우드 차트는 추세의 끝을 더 잘 식별할 수 있습니다.
- 신호는 명확하고 객관적입니다. 거래 신호는 기술적 지표에 의해 자동으로 생성되므로 주관적인 판단의 간섭이 줄어듭니다.
전략적 위험
- 변동성이 큰 시장의 위험: 횡보장이고 변동성이 큰 시장에서는 빈번하게 잘못된 신호가 생성되어 지속적인 손절매가 발생할 수 있습니다.
- 지연 위험: 이동 평균선과 이치모쿠 클라우드 차트에는 모두 어느 정도 지연이 있으며, 빠른 시장에서는 최적의 진입 시점을 놓칠 수 있습니다.
- 매개변수 민감도: 전략의 효과는 매개변수 설정에 따라 달라지며, 시장 환경에 따라 매개변수를 조정해야 할 수도 있습니다.
전략 최적화 방향
- 시장 환경 필터링 추가: 다양한 시장 환경에서 전략 매개변수를 조정하기 위해 변동성 지표나 추세 강도 지표를 추가할 수 있습니다.
- 손실제한 메커니즘을 최적화하세요. 트레일링 손실제한이나 ATR 기반 손실제한 설정과 같은 동적 손실제한을 사용하는 것을 고려하세요.
- 신호 확인 메커니즘 개선: 볼륨, 모멘텀과 같은 보조 지표를 추가하여 신호 안정성을 개선할 수 있습니다.
- 포지션 관리 소개: 신호 강도와 시장 변동성에 따라 포지션 크기를 동적으로 조정합니다.
요약하다
이 전략은 EMA 크로스오버와 이치모쿠 클라우드 차트의 유기적인 조합을 통해 추세 추적과 반전 캡처 기능을 모두 갖춘 거래 시스템을 구축합니다. 전략은 합리적으로 설계되었으며, 위험 통제가 제대로 갖춰져 있고, 실제 적용 가치가 좋습니다. 제안된 최적화 방향을 통해 전략을 더욱 개선할 수 있는 여지가 여전히 남아 있습니다. 실시간으로 적용할 경우, 백테스팅을 통해 적절한 매개변수 조합을 먼저 결정한 다음, 실제 시장 상황에 따라 동적으로 조정하는 것이 좋습니다.
Source
Pine
Strategy parameters
Related strategies
Comment
All comments (0)
No data
- 1