
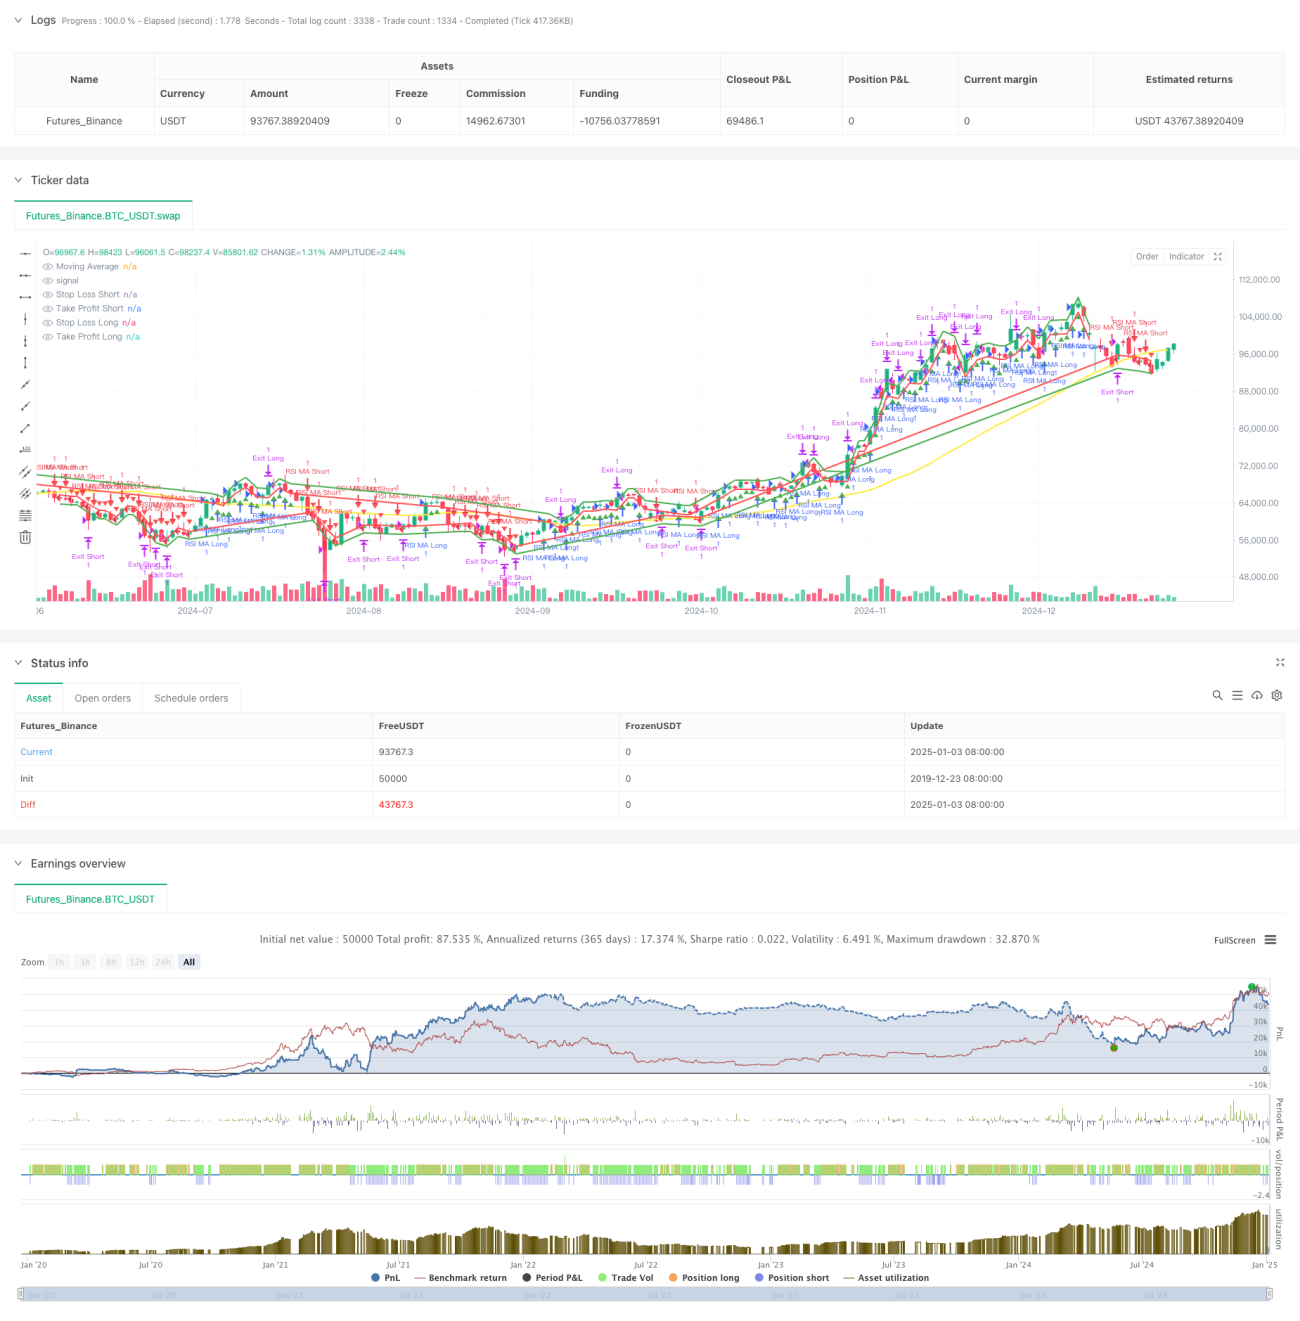
이 전략은 상대 강도 지수(RSI)와 단순 이동 평균(SMA)을 결합한 추세 추종 거래 시스템입니다. 이 전략은 이동 평균을 사용하여 시장 추세의 방향을 파악하고 RSI 지표를 사용하여 모멘텀을 확인하여 추세와 모멘텀이 공명할 때 거래를 수행합니다. 이 전략은 위험을 효과적으로 통제할 수 있는 완전한 손절매 및 손절매 메커니즘을 설계했습니다.
전략의 핵심 논리는 두 가지 기술 지표를 결합해서 사용하는 데 기초합니다.
거래 신호 생성 논리:
위험 관리에는 진입 가격의 고정 백분율로 각각 설정되는 백분율 손절매 및 이익 실현 방법이 사용됩니다.
이 전략은 추세 지표와 모멘텀 지표를 결합하여 명확한 논리와 통제 가능한 위험을 갖춘 거래 시스템을 구축합니다. 몇 가지 본질적인 위험이 있기는 하지만, 이 전략은 합리적인 매개변수 설정과 위험 관리를 통해 좋은 실용성을 보여줍니다. 이후의 최적화 방향은 주로 동적 매개변수 조정, 시장 환경 식별, 신호 품질 개선에 중점을 둘 것이며, 이를 통해 전략의 안정성과 수익성이 더욱 향상될 것으로 기대됩니다.
/*backtest
start: 2019-12-23 08:00:00
end: 2025-01-04 08:00:00
period: 1d
basePeriod: 1d
exchanges: [{"eid":"Futures_Binance","currency":"BTC_USDT"}]
*/
// This Pine Script™ code is subject to the terms of the Mozilla Public License 2.0 at https://mozilla.org/MPL/2.0/
// © raiford87
//@version=6
strategy("RSI + MA Trend Strategy (v6)",
shorttitle="RSI_MA_Trend_v6",
overlay=true,
initial_capital=50000,
default_qty_type=strategy.fixed,
default_qty_value=1)
// ─────────────────────────────────────────────────────────────────────────────────────
// 1. USER INPUTS
// ─────────────────────────────────────────────────────────────────────────────────────
maLength = input.int(50, "Moving Average Length")
rsiLength = input.int(14, "RSI Length")
rsiBuyLevel = input.int(55, "RSI > X for Buy", minval=1, maxval=99)
rsiSellLevel = input.int(45, "RSI < X for Sell", minval=1, maxval=99)
stopLossPerc = input.float(1.0, "Stop Loss %", minval=0.1)
takeProfitPerc = input.float(2.0, "Take Profit %", minval=0.1)
// ─────────────────────────────────────────────────────────────────────────────────────
// 2. INDICATOR CALCULATIONS
// ─────────────────────────────────────────────────────────────────────────────────────
maValue = ta.sma(close, maLength)
rsiVal = ta.rsi(close, rsiLength)
// Trend conditions
bullTrend = close > maValue
bearTrend = close < maValue
// RSI conditions
rsiBull = rsiVal > rsiBuyLevel
rsiBear = rsiVal < rsiSellLevel
// ─────────────────────────────────────────────────────────────────────────────────────
// 3. ENTRY CONDITIONS
// ─────────────────────────────────────────────────────────────────────────────────────
longCondition = bullTrend and rsiBull
shortCondition = bearTrend and rsiBear
if longCondition
strategy.entry("RSI MA Long", strategy.long)
if shortCondition
strategy.entry("RSI MA Short", strategy.short)
// ─────────────────────────────────────────────────────────────────────────────────────
// 4. STOP LOSS & TAKE PROFIT
// ─────────────────────────────────────────────────────────────────────────────────────
stopLossLevel = stopLossPerc * 0.01
takeProfitLevel = takeProfitPerc * 0.01
if strategy.position_size > 0
stopPriceLong = strategy.position_avg_price * (1 - stopLossLevel)
tpPriceLong = strategy.position_avg_price * (1 + takeProfitLevel)
strategy.exit("Exit Long", from_entry="RSI MA Long", stop=stopPriceLong, limit=tpPriceLong)
if strategy.position_size < 0
stopPriceShort = strategy.position_avg_price * (1 + stopLossLevel)
tpPriceShort = strategy.position_avg_price * (1 - takeProfitLevel)
strategy.exit("Exit Short", from_entry="RSI MA Short", stop=stopPriceShort, limit=tpPriceShort)
// ─────────────────────────────────────────────────────────────────────────────────────
// 5. PLOT SIGNALS & LEVELS
// ─────────────────────────────────────────────────────────────────────────────────────
plot(maValue, color=color.yellow, linewidth=2, title="Moving Average")
plotchar(longCondition, title="Long Signal", char='▲', location=location.belowbar, color=color.green, size=size.tiny)
plotchar(shortCondition, title="Short Signal", char='▼', location=location.abovebar, color=color.red, size=size.tiny)
// Plot Stop & TP lines
posIsLong = strategy.position_size > 0
posIsShort = strategy.position_size < 0
plotStopLong = posIsLong ? strategy.position_avg_price * (1 - stopLossLevel) : na
plotTpLong = posIsLong ? strategy.position_avg_price * (1 + takeProfitLevel): na
plotStopShort= posIsShort? strategy.position_avg_price * (1 + stopLossLevel) : na
plotTpShort = posIsShort? strategy.position_avg_price * (1 - takeProfitLevel): na
plot(plotStopLong, color=color.red, linewidth=2, style=plot.style_line, title="Stop Loss Long")
plot(plotTpLong, color=color.green, linewidth=2, style=plot.style_line, title="Take Profit Long")
plot(plotStopShort, color=color.red, linewidth=2, style=plot.style_line, title="Stop Loss Short")
plot(plotTpShort, color=color.green, linewidth=2, style=plot.style_line, title="Take Profit Short")