Camarilla 지원 및 저항 추세 거래 시스템과 결합된 다중 이동 평균 교차

EMA CPR SR
생성 날짜: 2025-01-06 11:13:31 마지막으로 수정됨: 2025-01-06 11:13:31
복사: 0 클릭수: 373
avatar of ChaoZhang ChaoZhang
1
집중하다
1617
수행원

Camarilla 지원 및 저항 추세 거래 시스템과 결합된 다중 이동 평균 교차

개요

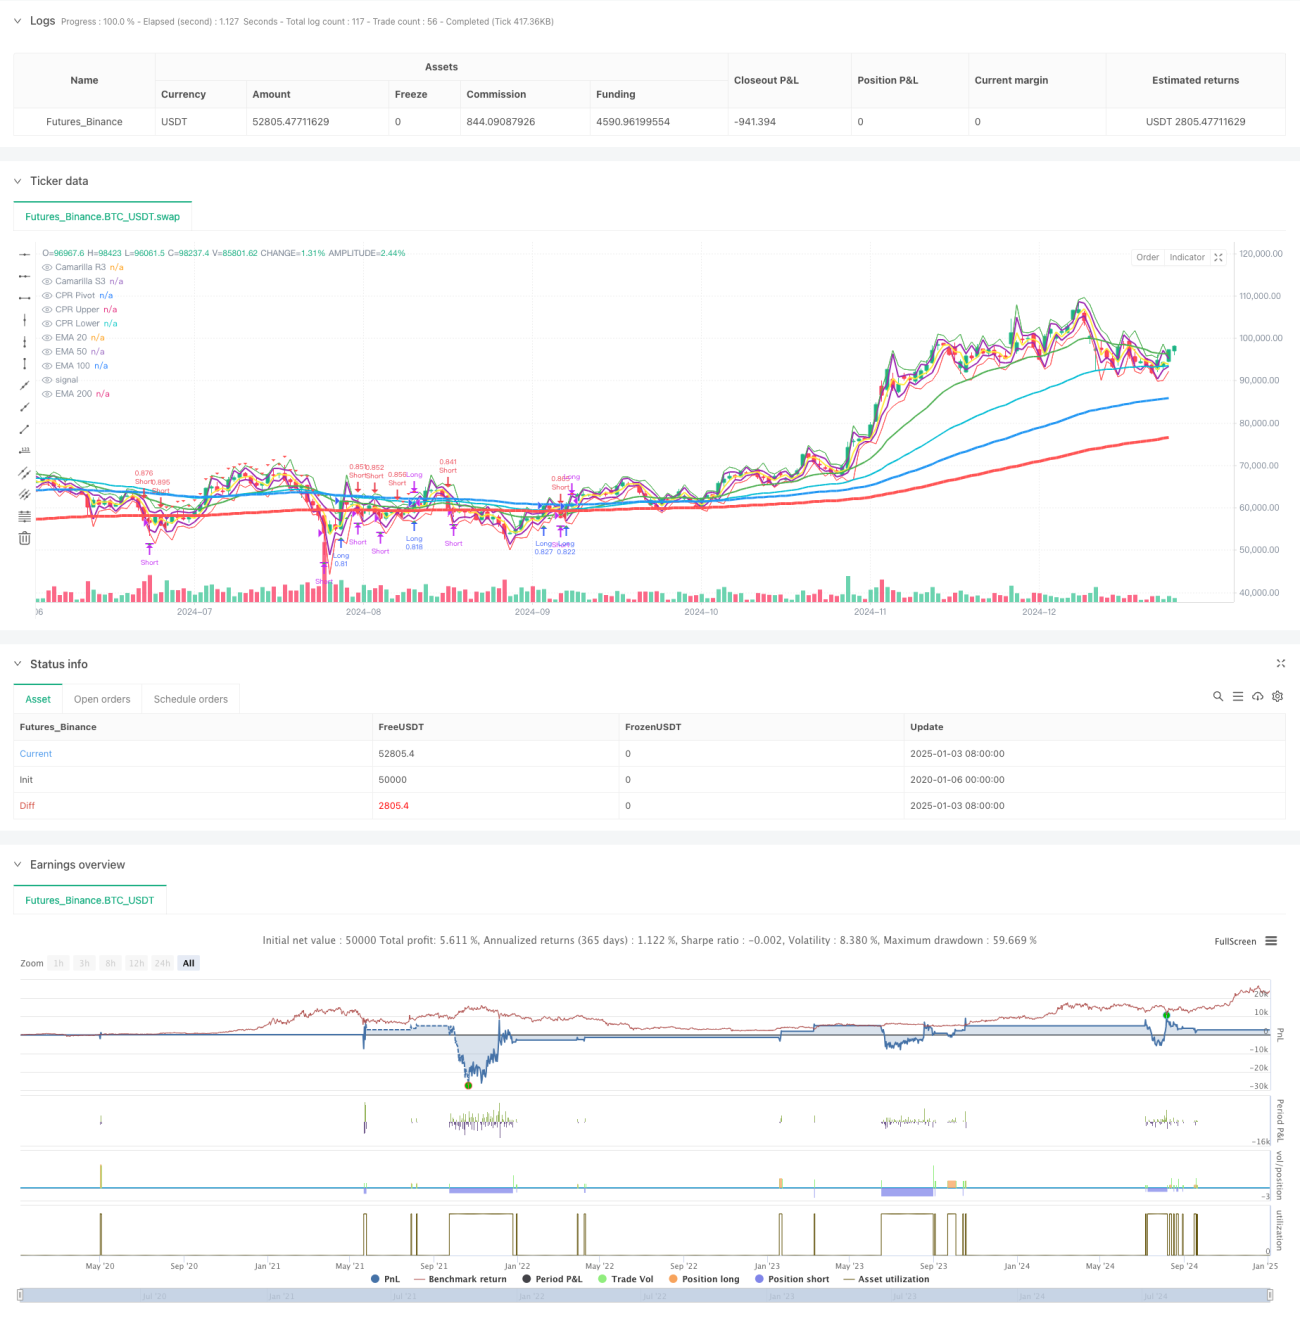
이 전략은 다중 지수 이동 평균선(EMA), 카마릴라 지지 및 저항 수준, 그리고 중앙 피벗 범위(CPR)를 결합한 추세 추종 거래 시스템입니다. 이 전략은 여러 이동 평균선과 주요 가격 범위에 대한 가격을 분석하여 시장 동향과 잠재적인 거래 기회를 파악합니다. 이 시스템은 백분율 포지션 크기와 다양한 종료 메커니즘을 포함하여 엄격한 자금 관리 및 위험 관리 조치를 채택합니다.

전략 원칙

이 전략은 다음과 같은 핵심 구성 요소를 기반으로 합니다.

  1. 다중 이동 평균 시스템(EMA20/50/100/200)은 추세 방향과 강도를 확인하는 데 사용됩니다.
  2. 카마릴라 지원 및 저항 수준(R3/S3)은 주요 가격 수준을 식별하는 데 사용됩니다.
  3. 중앙가격범위(CPR)는 일중 거래 범위를 결정하는 데 사용됩니다.
  4. 진입 신호는 EMA200과 가격의 교차 및 EMA20에 의한 확인을 기반으로 합니다.
  5. 종료 전략에는 고정 포인트와 백분율 이동 모드가 포함됩니다.
  6. 펀드 관리 시스템은 계정 규모에 따라 포지션 규모를 동적으로 조정합니다.

전략적 이점

  1. 다차원 기술 지표의 조합은 보다 안정적인 거래 신호를 제공합니다.
  2. 다양한 시장 환경에 적응할 수 있는 유연한 종료 메커니즘
  3. 완벽한 자금관리 시스템으로 효과적으로 리스크를 통제합니다
  4. 추세 추종 기능은 큰 움직임을 포착하는 데 도움이 됩니다.
  5. 시각화 구성 요소를 통해 트레이더는 시장 구조를 더 쉽게 이해할 수 있습니다.

전략적 위험

  1. 변동성이 큰 시장에서는 거짓 신호가 발생할 수 있습니다.
  2. 여러 지표로 인해 거래 신호가 지연될 수 있습니다.
  3. 변동성이 큰 시장에서는 고정 종료 지점이 좋은 성과를 내지 못할 수 있습니다.
  4. 인출을 견뎌내기 위해서는 더 큰 규모의 기금이 필요합니다.
  5. 거래 비용은 전략의 전체 수익에 영향을 미칠 수 있습니다.

전략 최적화 방향

  1. 진입 및 종료 매개변수를 동적으로 조정하기 위해 변동성 지표를 도입합니다.
  2. 다양한 시장 환경에 적응하기 위해 시장 상태 인식 모듈 추가
  3. 펀드 관리 시스템 최적화 및 동적 포지션 관리 기능 추가
  4. 신호 품질을 개선하기 위해 거래 시간 필터 추가
  5. 신호 안정성을 향상하기 위해 볼륨 분석 추가를 고려하세요

요약하다

이 전략은 여러 가지 고전적인 기술 분석 도구를 통합하여 완전한 거래 시스템을 구축합니다. 이 시스템의 장점은 다차원적인 시장 분석과 엄격한 위험 관리에 있지만, 다양한 시장 환경에 대한 적응성에도 주의해야 합니다. 지속적인 최적화와 개선을 통해 안정성을 유지하는 동시에 수익성도 개선될 것으로 기대됩니다.

전략 소스 코드
/*backtest
start: 2020-01-06 00:00:00
end: 2025-01-04 08:00:00
period: 1d
basePeriod: 1d
exchanges: [{"eid":"Futures_Binance","currency":"BTC_USDT"}]
*/

//@version=5
strategy("Pradeep Crude oil Entry and Exit", overlay=true)

// Input settings for EMAs
ema20_period = input.int(20, title="EMA 20 Period")
ema50_period = input.int(50, title="EMA 50 Period")
ema100_period = input.int(100, title="EMA 100 Period")
ema200_period = input.int(200, title="EMA 200 Period")

// Fixed line width settings for EMAs
ema20_width = 2  // EMA 20 Line Width
ema50_width = 2  // EMA 50 Line Width
ema100_width = 3 // EMA 100 Line Width
ema200_width = 4 // EMA 200 Line Width

// Backtesting inputs
initial_capital = input.float(50000, title="Initial Capital", minval=100)
position_size_percent = input.float(100, title="Position Size (% of Capital)", minval=0.1, maxval=100)
exit_mode = input.string("Price Movement", title="Exit Mode", options=["Price Movement", "Percentage Movement"])
exit_points = input.int(20, title="Exit After X Points", minval=1)
exit_percentage = input.float(1.0, title="Exit After X% Movement", minval=0.1, step=0.1)

// Calculate EMAs
ema20 = ta.ema(close, ema20_period)
ema50 = ta.ema(close, ema50_period)
ema100 = ta.ema(close, ema100_period)
ema200 = ta.ema(close, ema200_period)

// Signal conditions
long_entry_condition = close > ema200 and close > ema20 and close[1] <= ema200
long_exit_condition = (exit_mode == "Price Movement" and close - strategy.position_avg_price >= exit_points * syminfo.mintick) or 
                      (exit_mode == "Percentage Movement" and (close - strategy.position_avg_price) / strategy.position_avg_price * 100 >= exit_percentage)
short_entry_condition = close < ema200 and close < ema20 and close[1] >= ema200
short_exit_condition = (exit_mode == "Price Movement" and strategy.position_avg_price - close >= exit_points * syminfo.mintick) or 
                       (exit_mode == "Percentage Movement" and (strategy.position_avg_price - close) / strategy.position_avg_price * 100 >= exit_percentage)

// Plot EMAs with specified line widths
plot(ema20, color=color.green, title="EMA 20", linewidth=ema20_width)
plot(ema50, color=color.aqua, title="EMA 50", linewidth=ema50_width)
plot(ema100, color=color.blue, title="EMA 100", linewidth=ema100_width)
plot(ema200, color=color.red, title="EMA 200", linewidth=ema200_width)

// Camarilla Pivot Calculation
prev_high = request.security(syminfo.tickerid, "D", high[1])
prev_low = request.security(syminfo.tickerid, "D", low[1])
prev_close = request.security(syminfo.tickerid, "D", close[1])

R3 = prev_close + (prev_high - prev_low) * 1.1 / 2
S3 = prev_close - (prev_high - prev_low) * 1.1 / 2

// Central Pivot Range (CPR) Calculation
pivot = (prev_high + prev_low + prev_close) / 3
upper_cpr = pivot + (prev_high - prev_low)
lower_cpr = pivot - (prev_high - prev_low)

// Plot Camarilla R3, S3 and CPR levels
plot(R3, color=color.purple, title="Camarilla R3", linewidth=2)
plot(S3, color=color.purple, title="Camarilla S3", linewidth=2)
plot(pivot, color=color.yellow, title="CPR Pivot", linewidth=2)
plot(upper_cpr, color=color.green, title="CPR Upper", linewidth=1)
plot(lower_cpr, color=color.red, title="CPR Lower", linewidth=1)

// Backtesting: Capital and position size
capital = initial_capital
risk_per_trade = (position_size_percent / 100) * capital

// Long positions
if long_entry_condition
    strategy.entry("Long", strategy.long, qty=risk_per_trade / close)
    // Display entry price label
    label.new(bar_index, close, text="Entry: " + str.tostring(close), color=color.green, style=label.style_label_up, yloc=yloc.belowbar)

if long_exit_condition
    strategy.close("Long")
    // Display exit price label
    label.new(bar_index, close, text="Exit: " + str.tostring(close), color=color.red, style=label.style_label_down, yloc=yloc.abovebar)

// Short positions
if short_entry_condition
    strategy.entry("Short", strategy.short, qty=risk_per_trade / close)
    // Display entry price label
    label.new(bar_index, close, text="Entry: " + str.tostring(close), color=color.red, style=label.style_label_down, yloc=yloc.abovebar)

if short_exit_condition
    strategy.close("Short")
    // Display exit price label
    label.new(bar_index, close, text="Exit: " + str.tostring(close), color=color.green, style=label.style_label_up, yloc=yloc.belowbar)

// Plot signals
plotshape(long_entry_condition, style=shape.triangleup, location=location.belowbar, color=color.new(color.green, 0), size=size.small, title="Long Entry")
plotshape(long_exit_condition, style=shape.triangledown, location=location.abovebar, color=color.new(color.red, 0), size=size.small, title="Long Exit")
plotshape(short_entry_condition, style=shape.triangledown, location=location.abovebar, color=color.new(color.red, 0), size=size.small, title="Short Entry")
plotshape(short_exit_condition, style=shape.triangleup, location=location.belowbar, color=color.new(color.green, 0), size=size.small, title="Short Exit")