
1
Follow
1781
Followers
개요
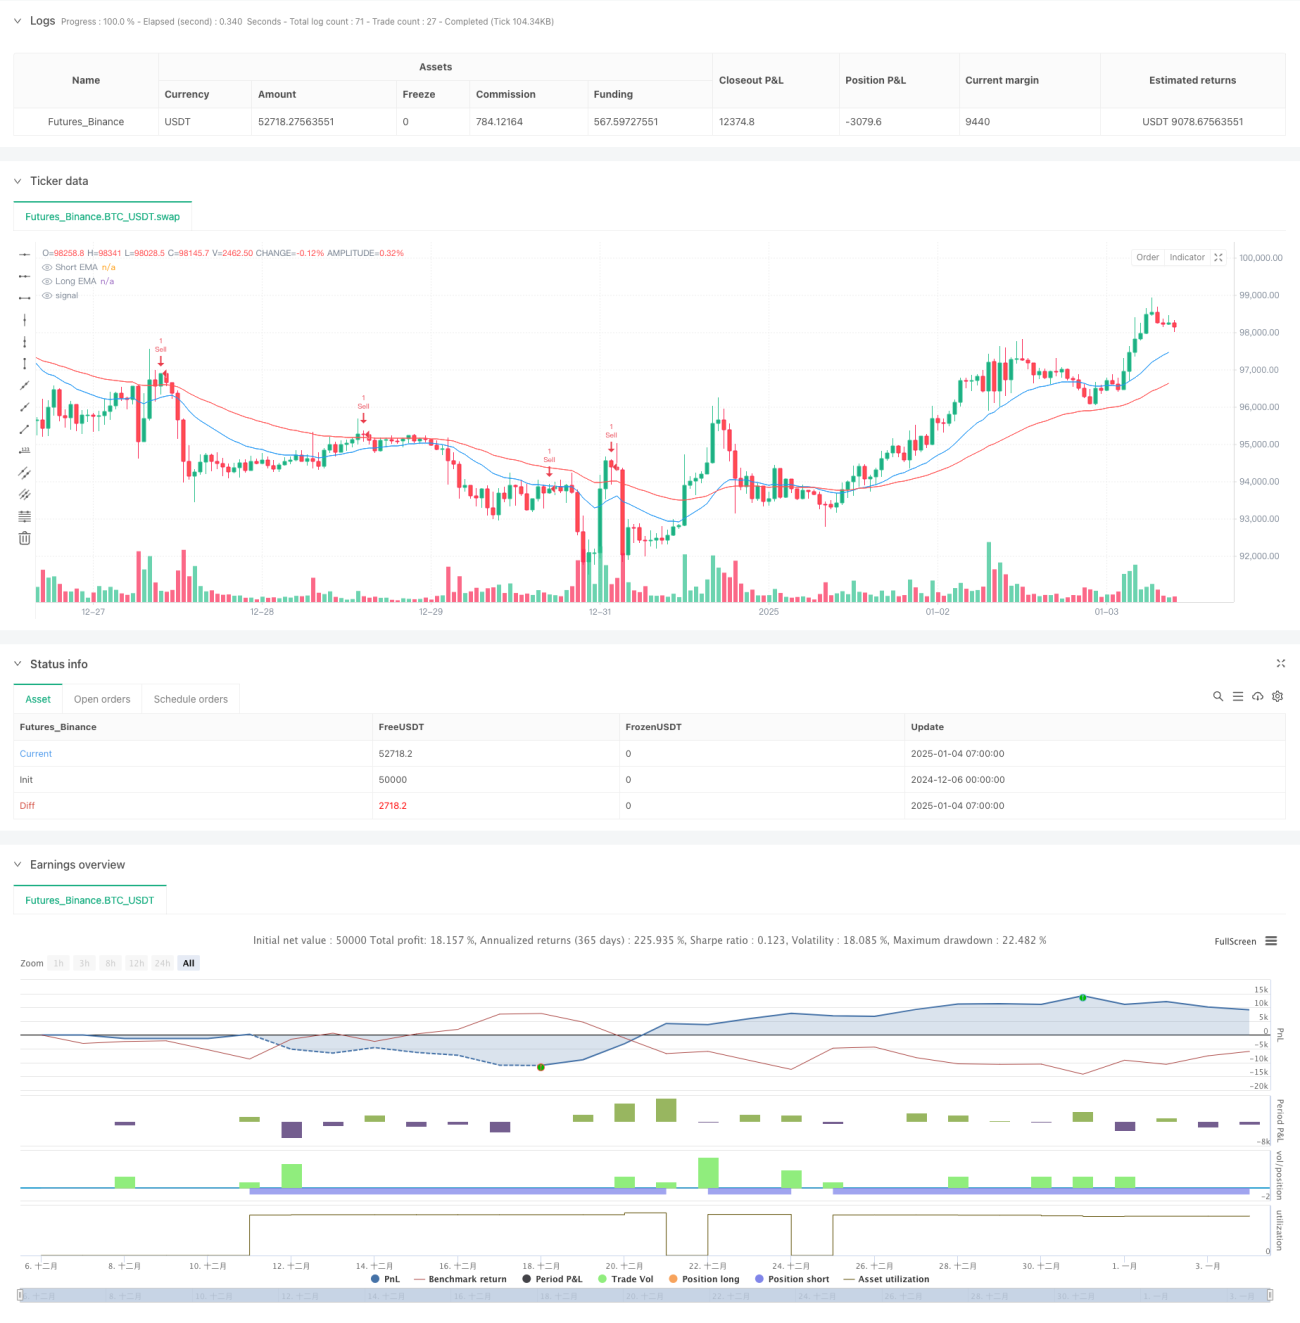
이 전략은 이중 지수 이동 평균(EMA)과 확률적 오실레이터를 결합한 양적 거래 시스템입니다. 20기간과 50기간 EMA를 사용하여 시장 동향을 파악하고, 확률적 오실레이터를 사용하여 매수 과다 및 매도 과다 영역에서 거래 기회를 찾아 추세와 모멘텀의 완벽한 조합을 달성합니다. 이 전략은 고정 손절매 및 이익 목표 설정을 포함한 엄격한 위험 관리 조치를 채택합니다.
전략 원칙
전략의 핵심 논리는 추세 판단, 진입 시점, 위험 관리라는 세 부분으로 나뉩니다. 추세 판단은 주로 빠른 EMA(20주기)와 느린 EMA(50주기)의 상대적 위치에 의존합니다. 빠른 선이 느린 선 위에 있으면 상승 추세로 판단되고, 그렇지 않으면 하락 추세로 판단됩니다. . 진입 신호는 확률적 오실레이터의 교차로 확인되며, 매수 과다 및 매도 과다 영역에서 높은 확률의 거래 기회를 찾습니다. 위험 관리에서는 고정 비율의 손절매와 2배의 이익 실현 비율 설정을 사용하여 각 거래에 명확한 위험-수익 비율이 적용되도록 합니다.
전략적 이점
- 추세 추적과 모멘텀 지표를 결합하면 추세 시장에서 안정적인 수익을 얻을 수 있습니다.
- 각 거래의 손실을 통제하기 위해 위험 비율을 고정하는 과학적 자금 관리 방법을 채택합니다.
- 지표 매개변수는 다양한 시장 특성에 따라 유연하게 조정 가능합니다.
- 전략 논리는 명확하고 이해하기 쉬우며 구현하기 쉽습니다.
- 다양한 시간대 거래에 적합
전략적 위험
- 변동성이 큰 시장에서는 잘못된 신호가 자주 발생할 수 있습니다.
- EMA 매개변수 선택은 전략 성과에 영향을 미칩니다.
- Stochastic Oscillator의 매수 과다 및 매도 과다 설정은 특정 시장에 맞게 조정되어야 합니다.
- 빠르게 움직이는 시장에서는 정지 간격이 너무 넓을 수 있습니다.
- 거래 비용이 전략 수익에 미치는 영향을 고려해야 합니다.
전략 최적화 방향
- 보조 확인으로 볼륨 표시기 추가
- ATR 지표를 소개하여 손절매 위치를 동적으로 조정합니다.
- 시장 변동성에 따른 지표 매개변수의 적응적 조정
- 거짓 신호를 줄이기 위해 추세 강도 필터 추가
- 적응형 이익 목표 계산 방법 개발
요약하다
이 전략은 추세 지표와 모멘텀 지표를 결합하여 완전한 거래 시스템을 만듭니다. 이 전략의 핵심적인 장점은 명확한 논리적 프레임워크와 엄격한 위험 관리에 있지만, 실제 적용에서는 여전히 특정 시장 상황에 따른 매개변수 최적화가 필요합니다. 지속적인 개선과 최적화를 통해 이 전략은 다양한 시장 환경에서 안정적인 성과를 유지할 것으로 기대됩니다.
Source
Pine
Strategy parameters
Related strategies
Comment
All comments (0)
No data
- 1