RSI 모멘텀과 거래량을 결합한 2기간 이동평균을 이용한 추세 추종 전략

1
Follow
1781
Followers
개요
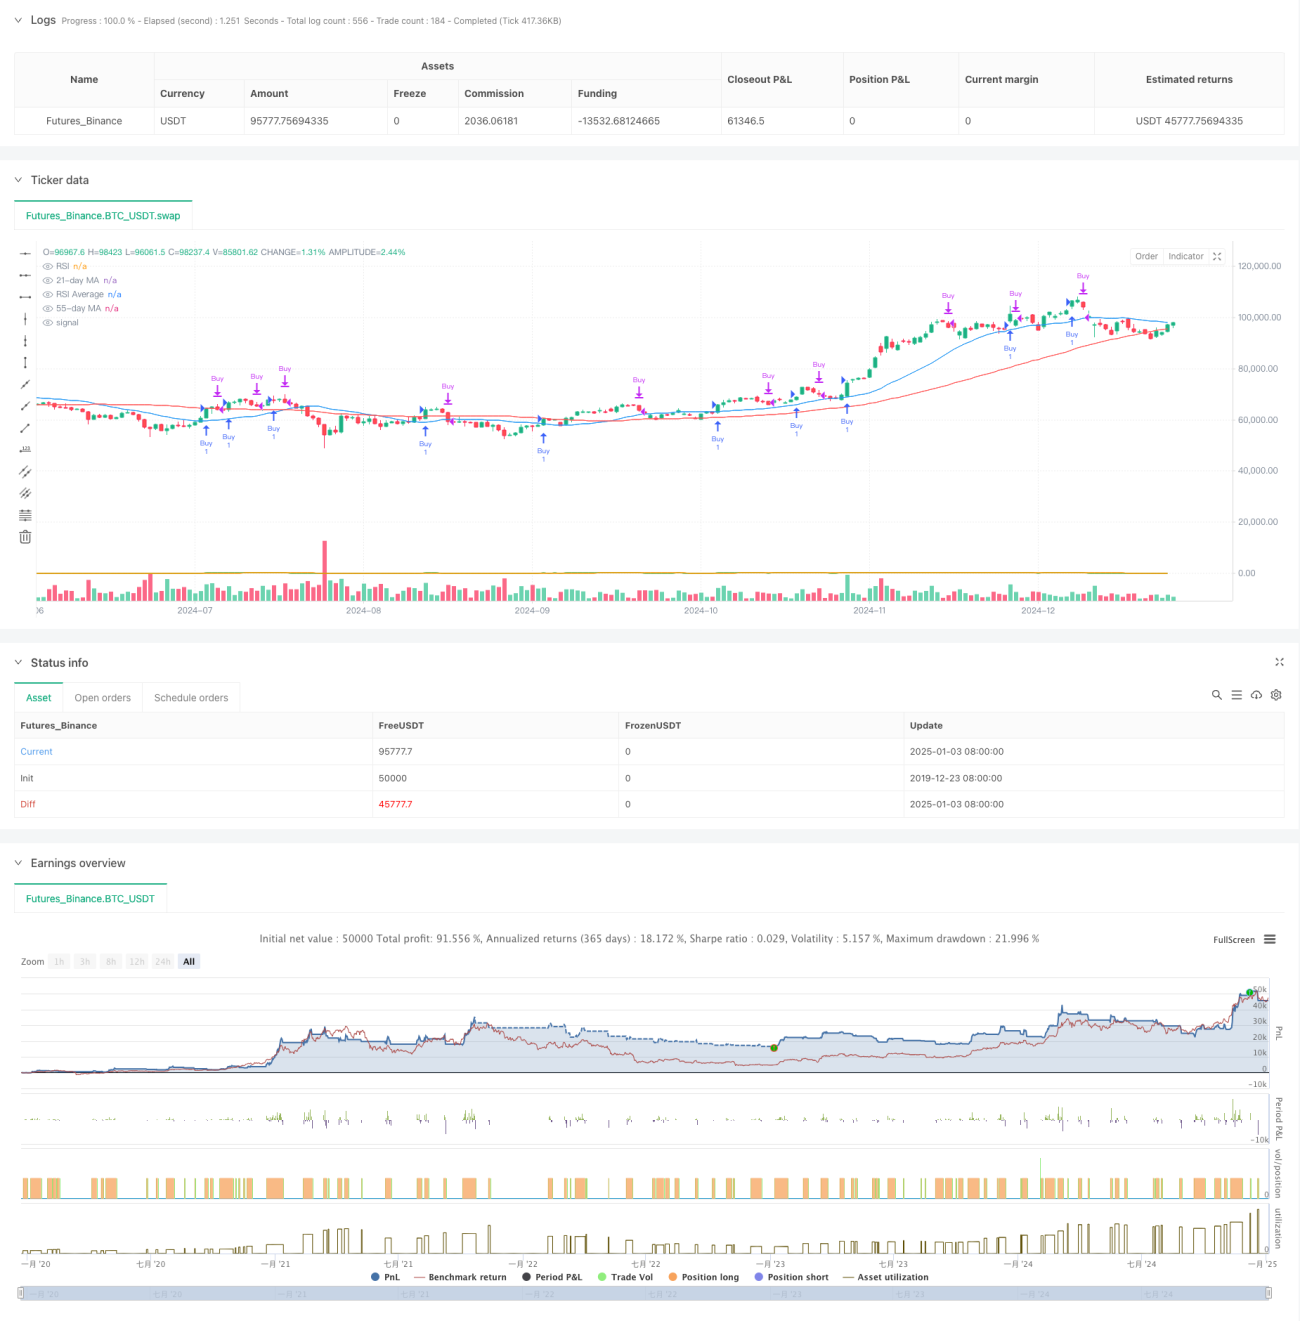
이는 2기간 이동평균(21과 55), RSI 모멘텀 지표, 거래량을 결합한 추세 추종 전략입니다. 이 전략은 가격, 모멘텀, 거래량의 세 가지 차원에서 시장 정보를 분석합니다. 추세 방향을 확인하는 동안 RSI와 거래량 지표를 통해 거래 신호를 필터링하여 거래 정확도를 개선합니다. 이 전략은 가격이 단기 이동 평균을 돌파하고 RSI가 이동 평균을 돌파할 때 거래량이 증가하여 추세의 타당성을 확인해야 합니다.
전략 원칙
이 전략은 3중 필터링 메커니즘을 사용합니다.
- 가격 필터: 21일 및 55일 이동 평균을 사용하여 가격 추세를 확인합니다. 종가가 21일 이동 평균보다 높으면 잠재적인 롱 기회로 간주됩니다.
- 모멘텀 필터: 13주기 RSI 지표와 해당 13주기 이동평균을 계산하고, RSI가 이동평균을 돌파할 때 모멘텀 방향을 확인합니다.
- 볼륨 필터: 시장 참여를 확인하기 위해 진입 시점의 이동 평균값보다 볼륨이 더 커야 하는 21기간 이동 평균 볼륨을 계산합니다.
구매 조건은 동시에 충족되어야 합니다:
- 종가가 21일 이동평균보다 높습니다.
- RSI는 이동평균보다 큽니다
- 거래량이 거래량 이동평균보다 큽니다.
판매 조건은 다음 중 하나일 수 있습니다.
- 가격이 55일 이동평균선 이하로 하락
- RSI가 이동평균선 아래로 떨어짐
전략적 이점
- 다차원 분석: 가격, 모멘텀, 거래량에 대한 종합적인 분석을 통해 신호의 신뢰성이 향상됩니다.
- 추세 확인: 이중 기간 이동 평균을 사용하면 추세의 방향과 강도를 더 잘 확인할 수 있습니다.
- 동적 적응성: RSI 지표는 시장 변동에 동적으로 적응하여 시장 모멘텀의 변화를 파악하는 데 도움이 됩니다.
- 거래량 및 가격 조정: 거래량을 필터로 사용하여 시장 활동이 활발한 기간 동안 거래가 발생하도록 합니다.
- 위험 관리: 명확한 손절매 조건을 설정하면 위험을 관리하는 데 도움이 됩니다.
전략적 위험
- 지연 위험: 이동 평균선은 본질적으로 지연 지표이므로 진입 및 청산 시점이 약간 지연될 수 있습니다.
- 변동성이 큰 시장의 위험: 횡보 시장에서는 거짓 돌파 신호가 자주 발생할 수 있습니다.
- 매개변수 민감도: 전략의 효과는 매개변수 설정에 민감하며, 다양한 시장 환경에 따라 매개변수 조정이 필요할 수 있습니다.
- 비용 위험: 잦은 거래로 인해 거래 비용이 높아질 수 있습니다.
- 유동성 위험: 유동성이 낮은 시장에서는 원하는 가격에 거래를 실행하는 것이 어려울 수 있습니다.
전략 최적화 방향
- 매개변수 적응: 시장 변동성에 따라 이동 평균 기간을 동적으로 조정하기 위해 적응 메커니즘을 도입할 수 있습니다.
- 신호 확인: 거래 신호를 더욱 필터링하기 위해 추세 강도 지표(예: ADX)를 추가할 수 있습니다.
- 이익 정지 최적화: 강력한 시장에서 더 많은 이익을 얻기 위해 동적 이익 정지 메커니즘을 설계할 수 있습니다.
- 포지션 관리: 포지션 크기는 신호 강도와 시장 변동성에 따라 동적으로 조정될 수 있습니다.
- 시간 필터: 불리한 기간 동안 거래를 피하기 위해 거래 시간 창을 추가할 수 있습니다.
요약하다
이는 기술적 분석의 3가지 주요 요소(가격, 거래량, 모멘텀)를 활용하는 추세 추종 전략입니다. 이 전략은 다양한 필터링 메커니즘을 통해 신호의 신뢰성을 보장할 뿐만 아니라 특정 위험 제어 기능도 갖추고 있습니다. 몇 가지 본질적인 한계는 있지만, 지속적인 최적화와 개선을 통해 이 전략은 실제 거래에서 안정적인 수익을 달성할 것으로 기대됩니다. 특히 추세가 명확하고 유동성이 충분한 시장에서는 이 전략이 더 나은 성과를 거둘 수 있습니다.
Source
Pine
Strategy parameters
Related strategies
Comment
All comments (0)
No data
- 1