
1
Follow
1781
Followers
개요
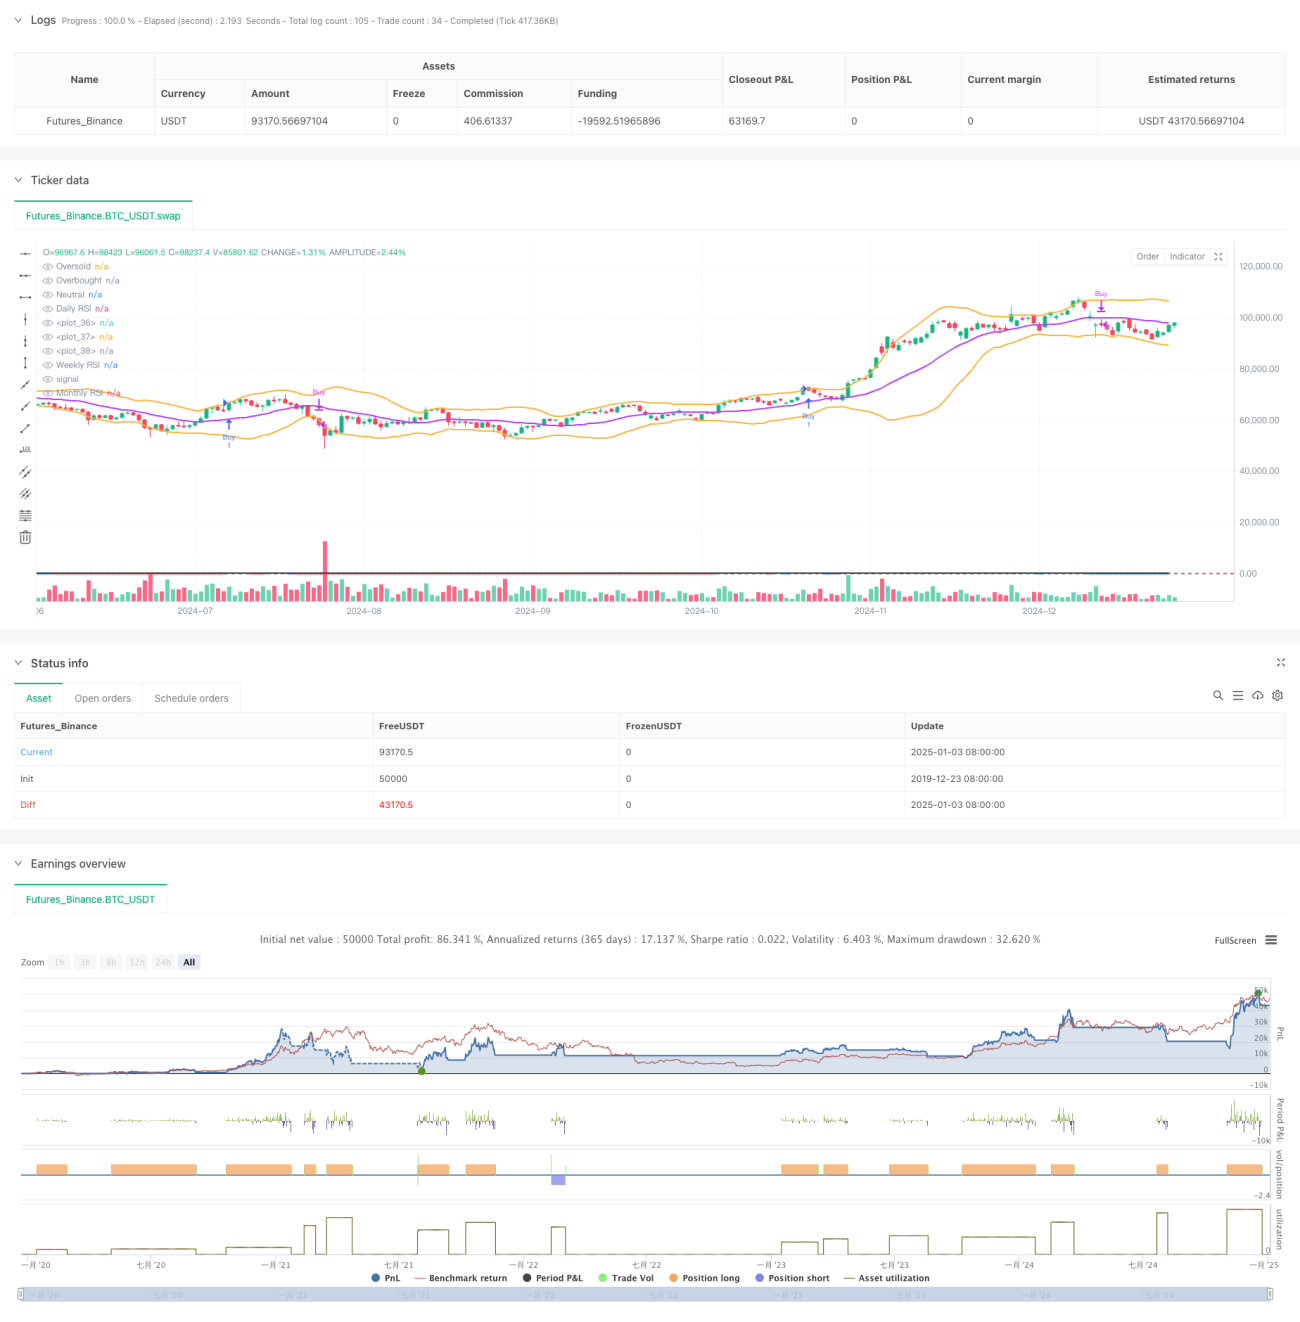
이 전략은 여러 지표를 결합한 복합 거래 시스템으로, 주로 지수 이동 평균(EMA), 슈퍼 트렌드, 볼린저 밴드, 상대 강도 지수(RSI)에 대한 포괄적인 분석을 기반으로 합니다. 이 전략의 핵심 논리는 EMA와 Supertrend를 중심으로 거래 신호를 구축하는 동시에 Bollinger Bands와 RSI를 결합하여 시장 변동성과 모멘텀에 대한 보조적 판단을 제공하는 것입니다. 거래 시스템은 일간, 주간, 월간 기간을 포함한 다중 기간 RSI 분석을 사용하여 거래 결정에 대한 보다 포괄적인 시장 관점을 제공합니다.
전략 원칙
이 전략은 다층 기술 지표를 조합하여 시장 동향과 변동성 기회를 포착합니다.
- 트리플 EMA(13, 34, 100)를 이용하여 추세추적체계를 구축하고 이동평균선 교차와 포지션 관계를 통해 추세방향을 파악한다.
- Supertrend 지표를 추세 확인 및 손절매 기준으로 통합
- ADX 지표를 사용하여 강력한 추세 시장을 선별하고 추세 강도 임계값을 25로 설정합니다.
- Bollinger Bands(20,2)를 사용하여 가격 변동을 모니터링합니다.
- 3기간 RSI(14)를 이용하여 시장의 매수과잉 및 매도과잉 상황을 분석한다.
거래 신호 트리거 조건:
- 롱 진입: 슈퍼트렌드가 롱으로 전환 + EMA13이 EMA34를 교차 + 가격이 EMA100 위에 유지 + ADX>25
- 단기 진입: 슈퍼트렌드가 롱으로 전환 + EMA13이 EMA34 아래로 교차 + 가격이 EMA100 아래로 하락 + ADX>25
- 마감 신호: 가격이 슈퍼트렌드를 교차할 때 해당 포지션을 종료합니다.
전략적 이점
- 여러 기술 지표를 통합하면 보다 안정적인 거래 신호가 제공되고 거짓 신호가 효과적으로 줄어듭니다.
- 트리플 EMA 시스템은 다양한 기간의 추세 특성을 완벽하게 파악할 수 있습니다.
- ADX 지표 도입으로 강력한 추세 시장에서만 거래할 수 있습니다.
- 다중 기간 RSI 분석은 시장 모멘텀에 대한 보다 포괄적인 평가를 제공합니다.
- Supertrend 지표는 객관적인 손절매 위치 참조를 제공합니다.
- Bollinger Bands 통합은 시장 변동성과 잠재적인 돌파 기회를 결정하는 데 도움이 됩니다.
전략적 위험
- 여러 개의 표시기 시스템으로 인해 신호 지연이 발생하여 진입 타이밍에 영향을 미칠 수 있습니다.
- 변동성이 큰 시장에서는 빈번하게 잘못된 돌파 신호가 발생할 수 있습니다.
- 고정 ADX 임계값은 다양한 시장 환경에서 일관되지 않게 작동할 수 있습니다.
- 급격하고 급격한 시장 변동은 비합리적인 손절매 배치로 이어질 수 있습니다.
위험 관리 제안:
- 다양한 시장 특성에 따라 ADX 임계값을 동적으로 조정합니다.
- 변동성 적응형 손절매 메커니즘 소개
- 신호 확인으로 볼륨 분석 추가
전략 최적화 방향
- 지표 매개변수 최적화
- 적응형 EMA 기간 도입을 고려하세요
- 변동성에 따라 Supertrend 계수를 동적으로 조정합니다.
- 다양한 시장 단계에 맞게 Bollinger Band 매개변수를 최적화하세요
- 신호 시스템 강화
- 거래 신호를 확인하기 위해 볼륨 요인을 통합합니다.
- 시장 구조 분석 추가
- 변동성 필터 소개
- 개선된 위험 관리
- 동적 손절매 메커니즘 설계
- 창고관리시스템 구축
- 거래 시간 필터 추가
요약하다
이 전략은 여러 기술 지표를 유기적으로 결합하여 비교적 완전한 거래 시스템을 구축합니다. EMA와 Supertrend를 조합하면 주요 거래 신호가 제공되고, ADX 스크리닝을 통해 강력한 추세 환경에서 거래가 이루어지는지 확인할 수 있으며, Bollinger Bands와 RSI를 보조적으로 분석하면 추가적인 시장 관점을 얻을 수 있습니다. 이 전략의 주요 장점은 신호 안정성과 시스템 무결성이지만, 신호 지연과 매개변수 최적화의 과제도 있습니다. 제안된 최적화 방향을 통해 안정성을 유지하면서도 수익성을 개선할 수 있는 전략이 기대됩니다.
Source
Pine
Strategy parameters
Related strategies
Comment
All comments (0)
No data
- 1