
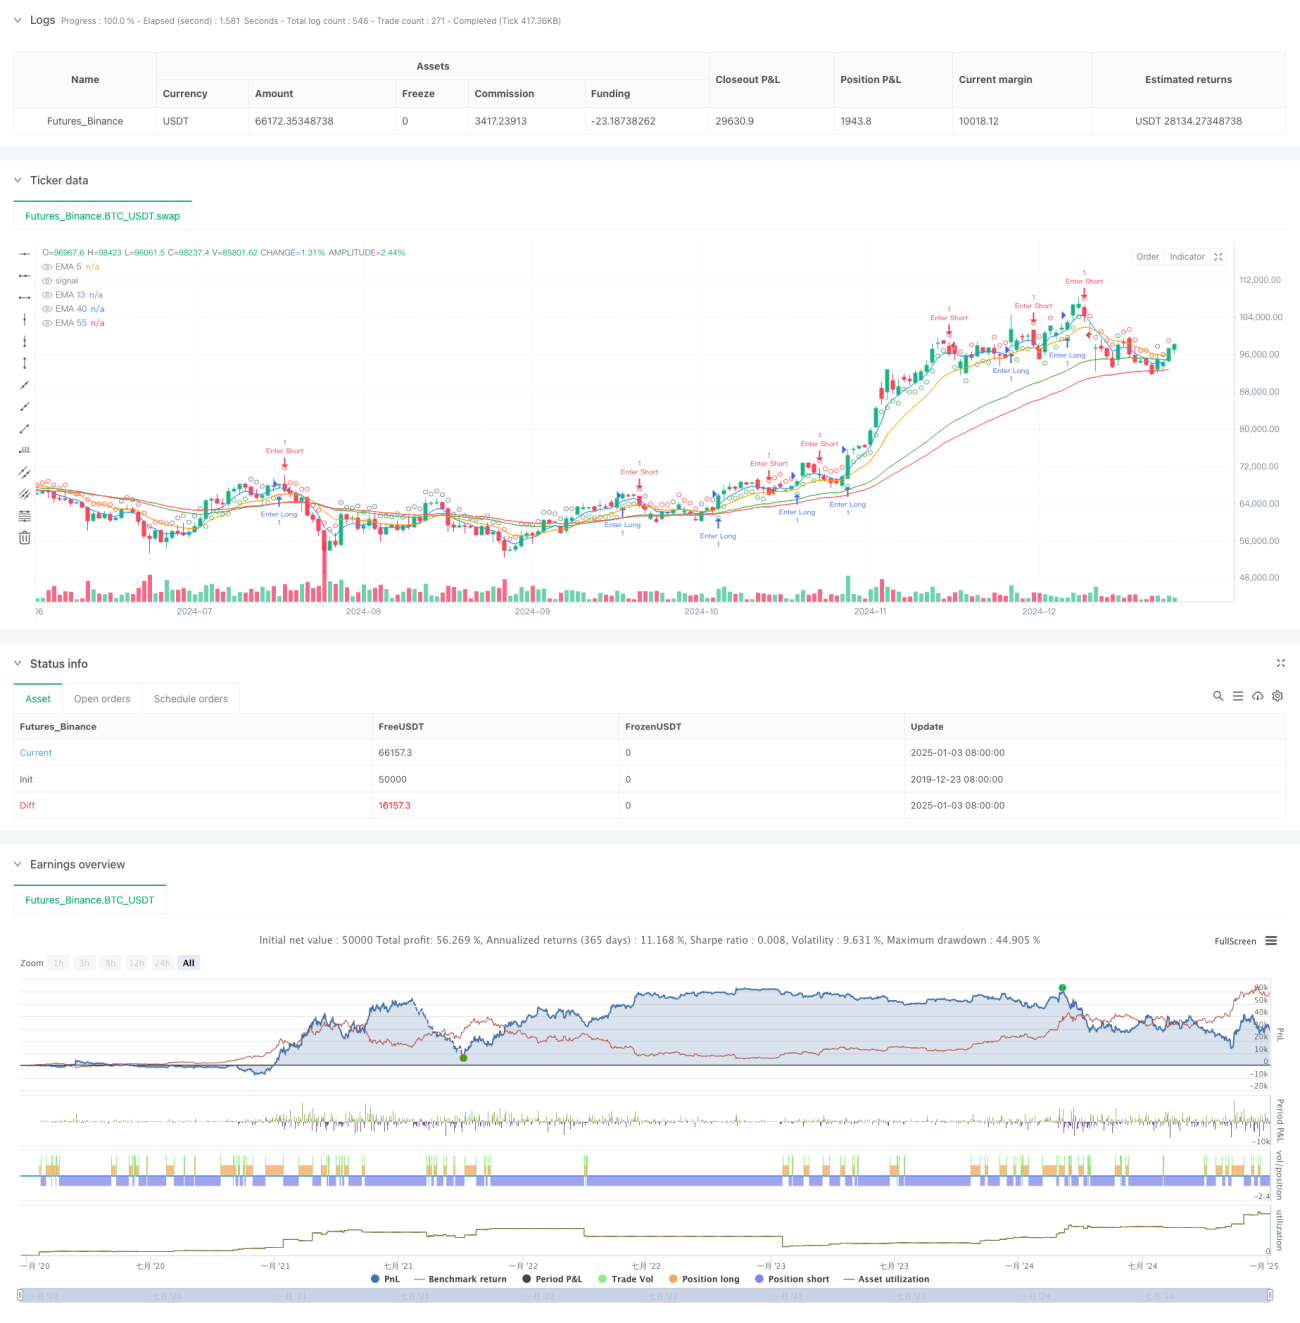
이 전략은 여러 가지 기술 지표를 기반으로 한 거래 시스템으로, 주로 지수 이동 평균(EMA), 상대 강도 지수(RSI), 거리 계산이라는 세 가지 핵심 구성 요소를 결합합니다. 이 전략은 신호 안정성을 유지하고 거짓 돌파구와 변동성 있는 시장 상황을 효과적으로 피하는 동시에, 시장 추세 강도와 모멘텀 변화를 역동적으로 모니터링합니다. 시스템은 다중 확인 메커니즘을 채택하고 지표 간의 상대적 거리와 동적 임계값을 계산하여 시장 상황에 대한 정확한 판단을 실현합니다.
이 전략은 서로 다른 기간(5, 13, 40, 55 기간)의 4개 EMA 선을 사용하여 추세 프레임워크를 구성하고 RSI 지표(14개 기간)를 사용하여 시장 방향 판단을 강화합니다. 구체적으로:
이 전략은 여러 기술 지표의 조정된 협력을 통해 신호 안정성을 유지하는 동시에 위험을 효과적으로 통제합니다. 시스템 설계는 시장의 다양성을 충분히 고려하고 동적 임계값 및 거리 계산 방법을 채택하여 적응성을 향상시켰습니다. 지속적인 최적화와 개선을 통해 이 전략은 다양한 시장 환경에서도 안정적인 성과를 유지할 것으로 기대됩니다.
/*backtest
start: 2019-12-23 08:00:00
end: 2025-01-04 08:00:00
period: 1d
basePeriod: 1d
exchanges: [{"eid":"Futures_Binance","currency":"BTC_USDT"}]
*/
//@version=6
strategy("EMA Crossover Strategy with RSI Average, Distance, and Signal Persistence", overlay=true, fill_orders_on_standard_ohlc=true)
// Define EMAs
ema5 = ta.ema(close, 5)
ema13 = ta.ema(close, 13)
ema40 = ta.ema(close, 40)
ema55 = ta.ema(close, 55)
// Calculate 14-period RSI
rsi = ta.rsi(close, 14)
// Calculate the RSI average
averageRsiLength = 14 // Length for RSI average
averageRsi = ta.sma(rsi, averageRsiLength)
// Define conditions
emaShortTermCondition = ema5 > ema13 // EMA 5 > EMA 13
emaLongTermCondition = ema40 > ema55 // EMA 40 > EMA 55
rsiCondition = rsi > 50 and rsi > averageRsi // RSI > 50 and RSI > average RSI
// Track the distance between ema5 and ema13 for the last 5 candles
distance = math.abs(ema5 - ema13)
distanceWindow = 5
distances = array.new_float(distanceWindow, 0.0)
array.shift(distances)
array.push(distances, distance)
// Calculate the average distance of the last 5 distances
avgDistance = array.avg(distances)
// Track distance between EMA40 and EMA13 for the last few candles
distance40_13 = math.abs(ema40 - ema13)
distanceWindow40_13 = 5
distances40_13 = array.new_float(distanceWindow40_13, 0.0)
array.shift(distances40_13)
array.push(distances40_13, distance40_13)
// Calculate the average distance for EMA40 and EMA13
avgDistance40_13 = array.avg(distances40_13)
// Neutral condition: if the current distance is lower than the average of the last 5 distances
neutralCondition = distance < avgDistance or ema13 > ema5
// Short signal condition: EMA40 crosses above EMA55
shortCondition = ema40 > ema55
// Conditions for Green and Red signals (based on RSI thresholds)
greenSignalCondition = rsi > 60 // Green if RSI > 60, regardless of EMAs
redSignalCondition = rsi < 40 // Red if RSI < 40, regardless of EMAs
// Combine conditions for a buy signal (Long)
longCondition = emaShortTermCondition and emaLongTermCondition and rsiCondition and not neutralCondition
// Store the last signal (initialized as na)
var string lastSignal = na
// Track previous distance between EMA40 and EMA13
var float prevDistance40_13 = na
// Check if the current distance between EMA40 and EMA13 is greater than the previous
distanceCondition = (not na(prevDistance40_13)) ? (distance40_13 > prevDistance40_13) : true
// Update the lastSignal only if the current candle closes above EMA5, otherwise recalculate it
if (close > ema5)
if (longCondition and distanceCondition)
lastSignal := "long"
else if (shortCondition and distanceCondition)
lastSignal := "short"
else if (neutralCondition)
lastSignal := "neutral"
// Add green signal based on RSI
else if (greenSignalCondition)
lastSignal := "green"
// Add red signal based on RSI
else if (redSignalCondition)
lastSignal := "red"
// If current candle doesn't close above EMA5, recalculate the signal based on current conditions
if (close <= ema5)
if (longCondition)
lastSignal := "long"
else if (shortCondition)
lastSignal := "short"
else if (greenSignalCondition)
lastSignal := "green"
else if (redSignalCondition)
lastSignal := "red"
else
lastSignal := "neutral"
// Update previous distance for next comparison
prevDistance40_13 := distance40_13
// Set signal conditions based on lastSignal
isLong = lastSignal == "long"
isShort = lastSignal == "short"
isNeutral = lastSignal == "neutral"
isGreen = lastSignal == "green"
isRed = lastSignal == "red"
// Plot signals with preference for long (green) and short (red), no multiple signals per bar
plotshape(isLong, style=shape.circle, color=color.green, location=location.belowbar, size=size.tiny)
plotshape(isShort and not isLong, style=shape.circle, color=color.red, location=location.abovebar, size=size.tiny)
plotshape(isNeutral and not isLong and not isShort, style=shape.circle, color=color.gray, location=location.abovebar, size=size.tiny)
plotshape(isGreen and not isLong and not isShort and not isNeutral, style=shape.circle, color=color.green, location=location.belowbar, size=size.tiny)
plotshape(isRed and not isLong and not isShort and not isNeutral, style=shape.circle, color=color.red, location=location.abovebar, size=size.tiny)
// Plot EMAs for visualization
plot(ema5, color=color.blue, title="EMA 5")
plot(ema13, color=color.orange, title="EMA 13")
plot(ema40, color=color.green, title="EMA 40")
plot(ema55, color=color.red, title="EMA 55")
// Plot RSI average for debugging (optional, remove if not needed)
// plot(averageRsi, title="Average RSI", color=color.orange)
// hline(50, title="RSI 50", color=color.gray) // Optional: Comment this out too if not needed
if isLong
strategy.entry("Enter Long", strategy.long)
else if isShort
strategy.entry("Enter Short", strategy.short)