
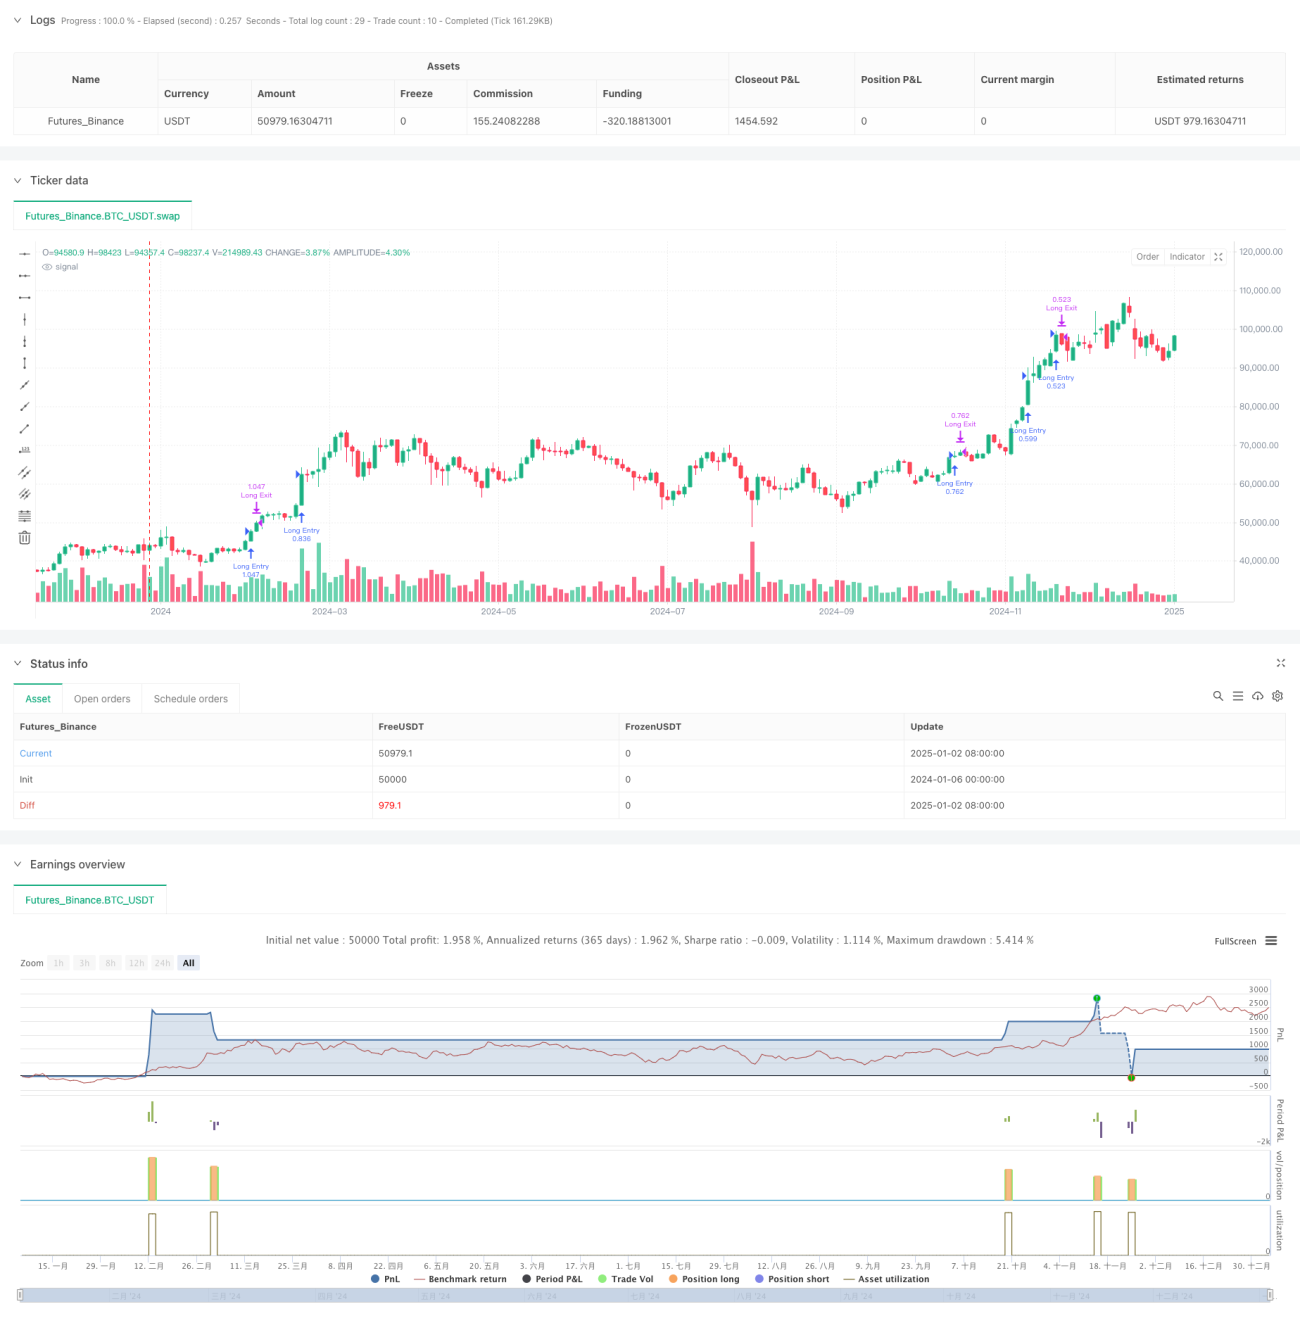
이 전략은 여러 기술 지표와 ICT(Institutional Trading Concept)를 결합한 포괄적인 거래 시스템입니다. 전통적인 기술 분석 지표(RSI, 확률 지표, MACD, EMA)와 현대 ICT 거래 개념(공정 가치 갭, 구조적 돌파, 높은 기간 편향 분석)을 다양한 기간으로 통합하고 엄격한 거래 기간을 필터링합니다. 정확한 시장 달성 접근 제어.
이 전략은 핵심 구성 요소 5가지의 조정을 기반으로 운영됩니다.
이 전략은 전통적인 기술 분석과 현대 ICT 개념을 통합하여 포괄적인 거래 시스템을 구축합니다. 이 방법은 다차원적 신호 확인과 엄격한 위험 관리가 장점이지만, 매개변수 최적화와 시장 적응력 측면에서도 어려움에 직면합니다. 지속적인 최적화와 개선을 통해 이 전략은 다양한 시장 환경에서도 안정적인 성과를 유지할 것으로 기대됩니다.
/*backtest
start: 2024-01-06 00:00:00
end: 2025-01-04 08:00:00
period: 2d
basePeriod: 2d
exchanges: [{"eid":"Futures_Binance","currency":"BTC_USDT"}]
*/
// -----------------------------------------------------
// Multi-Signal Conservative Strategy (Pine Script v5)
// + More ICT Concepts (HTF Bias, FVG, Killzone, BOS)
// -----------------------------------------------------
//
// Combines:
// - RSI, Stochastic, MACD, 200 EMA (lower TF)
// - Higher Timeframe (HTF) bias check via 200 EMA
// - Kill Zone time filter
// - Fair Value Gap (FVG) detection (simplified 3-candle approach)
// - Break of Structure (BOS) using pivot highs/lows
// - Only trade markers on chart (no extra indicator plots).
//
// Use on lower timeframes: 1m to 15m
// Always backtest thoroughly and manage risk properly.
//
// -----------------------------------------------------
//@version=5
strategy(title="Multi-Signal + ICT Concepts (HTF/FVG/Killzone/BOS)", shorttitle="ICTStrategyExample",overlay=true, pyramiding=0, initial_capital=10000, default_qty_type=strategy.percent_of_equity, default_qty_value=100)
// -----------------------------------------------------
// User Inputs
// -----------------------------------------------------
/////////////// Lower TF Inputs ///////////////
emaLength = input.int(200, "LTF EMA Length", group="Lower TF")
rsiLength = input.int(14, "RSI Length", group="Lower TF")
rsiUpper = input.int(60, "RSI Overbought Thresh", group="Lower TF", minval=50, maxval=80)
rsiLower = input.int(40, "RSI Oversold Thresh", group="Lower TF", minval=20, maxval=50)
stochLengthK = input.int(14, "Stoch K Length", group="Lower TF")
stochLengthD = input.int(3, "Stoch D Smoothing", group="Lower TF")
stochSmooth = input.int(3, "Stoch Smoothing", group="Lower TF")
macdFast = input.int(12, "MACD Fast Length", group="Lower TF")
macdSlow = input.int(26, "MACD Slow Length", group="Lower TF")
macdSignal = input.int(9, "MACD Signal Length", group="Lower TF")
/////////////// ICT Concepts Inputs ///////////////
htfTimeframe = input.timeframe("60", "HTF for Bias (e.g. 60, 240)", group="ICT Concepts")
htfEmaLen = input.int(200, "HTF EMA Length", group="ICT Concepts")
sessionInput = input("0700-1000:1234567", "Kill Zone Window", group="ICT Concepts")
fvgLookbackBars = input.int(2, "FVG Lookback Bars (3-candle check)", group="ICT Concepts", minval=1, maxval=10)
/////////////// Risk Management ///////////////
stopLossPerc = input.float(0.5, "Stop-Loss %", step=0.1, group="Risk")
takeProfitPerc = input.float(1.0, "Take-Profit %", step=0.1, group="Risk")
// -----------------------------------------------------
// 1) Higher Timeframe Bias
// -----------------------------------------------------
//
// We'll request the HTF close, then compute the HTF EMA on that data
// to decide if it's bullish or bearish overall.
htfClose = request.security(syminfo.tickerid, htfTimeframe, close)
htfEma = request.security(syminfo.tickerid, htfTimeframe, ta.ema(close, htfEmaLen))
isBullHTF = htfClose > htfEma
isBearHTF = htfClose < htfEma
// -----------------------------------------------------
// 2) Kill Zone / Session Filter
// -----------------------------------------------------
//
// We'll only consider trades if the current bar is within
// the user-defined session time (e.g., 07:00 to 10:00 local or exchange time).
isInKillZone = time(timeframe.period, sessionInput) != 0
// -----------------------------------------------------
// 3) Fair Value Gap (FVG) Detection (Simplified)
//
// For a "Bullish FVG" among bars [2], [1], [0]:
// high[2] < low[0] => there's a gap that bar [1] didn't fill
// For a "Bearish FVG":
// low[2] > high[0] => there's a gap that bar [1] didn't fill
//
// Real ICT usage might check partial fill, candle bodies vs wicks, etc.
// This is just a minimal example for demonstration.
fvgBarsAgo = fvgLookbackBars // default = 2
bullFVG = high[fvgBarsAgo] < low // e.g. high[2] < low[0]
bearFVG = low[fvgBarsAgo] > high // e.g. low[2] > high[0]
// -----------------------------------------------------
// 4) Break of Structure (BOS)
// -----------------------------------------------------
// Using pivot detection from previous example:
swingLen = 2 // pivot detection length (bars on each side)
// Identify a pivot high at bar [1]
swingHigh = high[1] > high[2] and high[1] > high[0]
// Identify a pivot low at bar [1]
swingLow = low[1] < low[2] and low[1] < low[0]
// Track the most recent pivot high & low
var float lastPivotHigh = na
var float lastPivotLow = na
if swingHigh
lastPivotHigh := high[1]
if swingLow
lastPivotLow := low[1]
bosUp = not na(lastPivotHigh) and (close > lastPivotHigh)
bosDown = not na(lastPivotLow) and (close < lastPivotLow)
// -----------------------------------------------------
// 5) Lower TF Indicator Calculations
// -----------------------------------------------------
ema200 = ta.ema(close, emaLength) // 200 EMA on LTF
rsiValue = ta.rsi(close, rsiLength)
kValue = ta.stoch(high, low, close, stochLengthK)
dValue = ta.sma(kValue, stochLengthD)
stochSignal = ta.sma(dValue, stochSmooth)
[macdLine, signalLine, histLine] = ta.macd(close, macdFast, macdSlow, macdSignal)
// LTF trend filter
isBullTrend = close > ema200
isBearTrend = close < ema200
// -----------------------------------------------------
// Combine All Conditions
// -----------------------------------------------------
//
// We'll require that all filters line up for a long or short:
// - HTF bias
// - kill zone
// - bullish/bearish FVG
// - BOS up/down
// - RSI, Stoch, MACD alignment
// - Price above/below LTF 200 EMA
longCondition = isInKillZone // must be in session
and isBullHTF // HTF bias bullish
and bullFVG // bullish FVG
and bosUp // BOS up
and (rsiValue > rsiUpper) // RSI > threshold
and (kValue > dValue) // stoch K above D
and (macdLine > signalLine) // MACD bullish
and isBullTrend // above LTF 200 EMA
shortCondition = isInKillZone // must be in session
and isBearHTF // HTF bias bearish
and bearFVG // bearish FVG
and bosDown // BOS down
and (rsiValue < rsiLower) // RSI < threshold
and (kValue < dValue) // stoch K below D
and (macdLine < signalLine) // MACD bearish
and isBearTrend // below LTF 200 EMA
// -----------------------------------------------------
// Strategy Entries
// -----------------------------------------------------
if longCondition
strategy.entry("Long Entry", strategy.long)
if shortCondition
strategy.entry("Short Entry", strategy.short)
// -----------------------------------------------------
// Risk Management (Stop-Loss & Take-Profit)
// -----------------------------------------------------
if strategy.position_size > 0
// Long position exit
strategy.exit("Long Exit", stop = strategy.position_avg_price * (1.0 - stopLossPerc/100.0), limit = strategy.position_avg_price * (1.0 + takeProfitPerc/100.0))
if strategy.position_size < 0
// Short position exit
strategy.exit("Short Exit", stop = strategy.position_avg_price * (1.0 + stopLossPerc/100.0), limit = strategy.position_avg_price * (1.0 - takeProfitPerc/100.0))
// -----------------------------------------------------
// Hide All Indicator Plots
// (We only show trade markers for entry & exit)
// -----------------------------------------------------
// Comment out or remove any plot() calls so chart stays clean.
//
// Example (commented out):
// plot(ema200, title="EMA 200", color=color.new(color.yellow, 0), linewidth=2)
// plot(rsiValue, title="RSI", color=color.new(color.blue, 0))
// plot(macdLine, title="MACD", color=color.new(color.teal, 0))
// plot(signalLine, title="Signal", color=color.new(color.purple, 0))