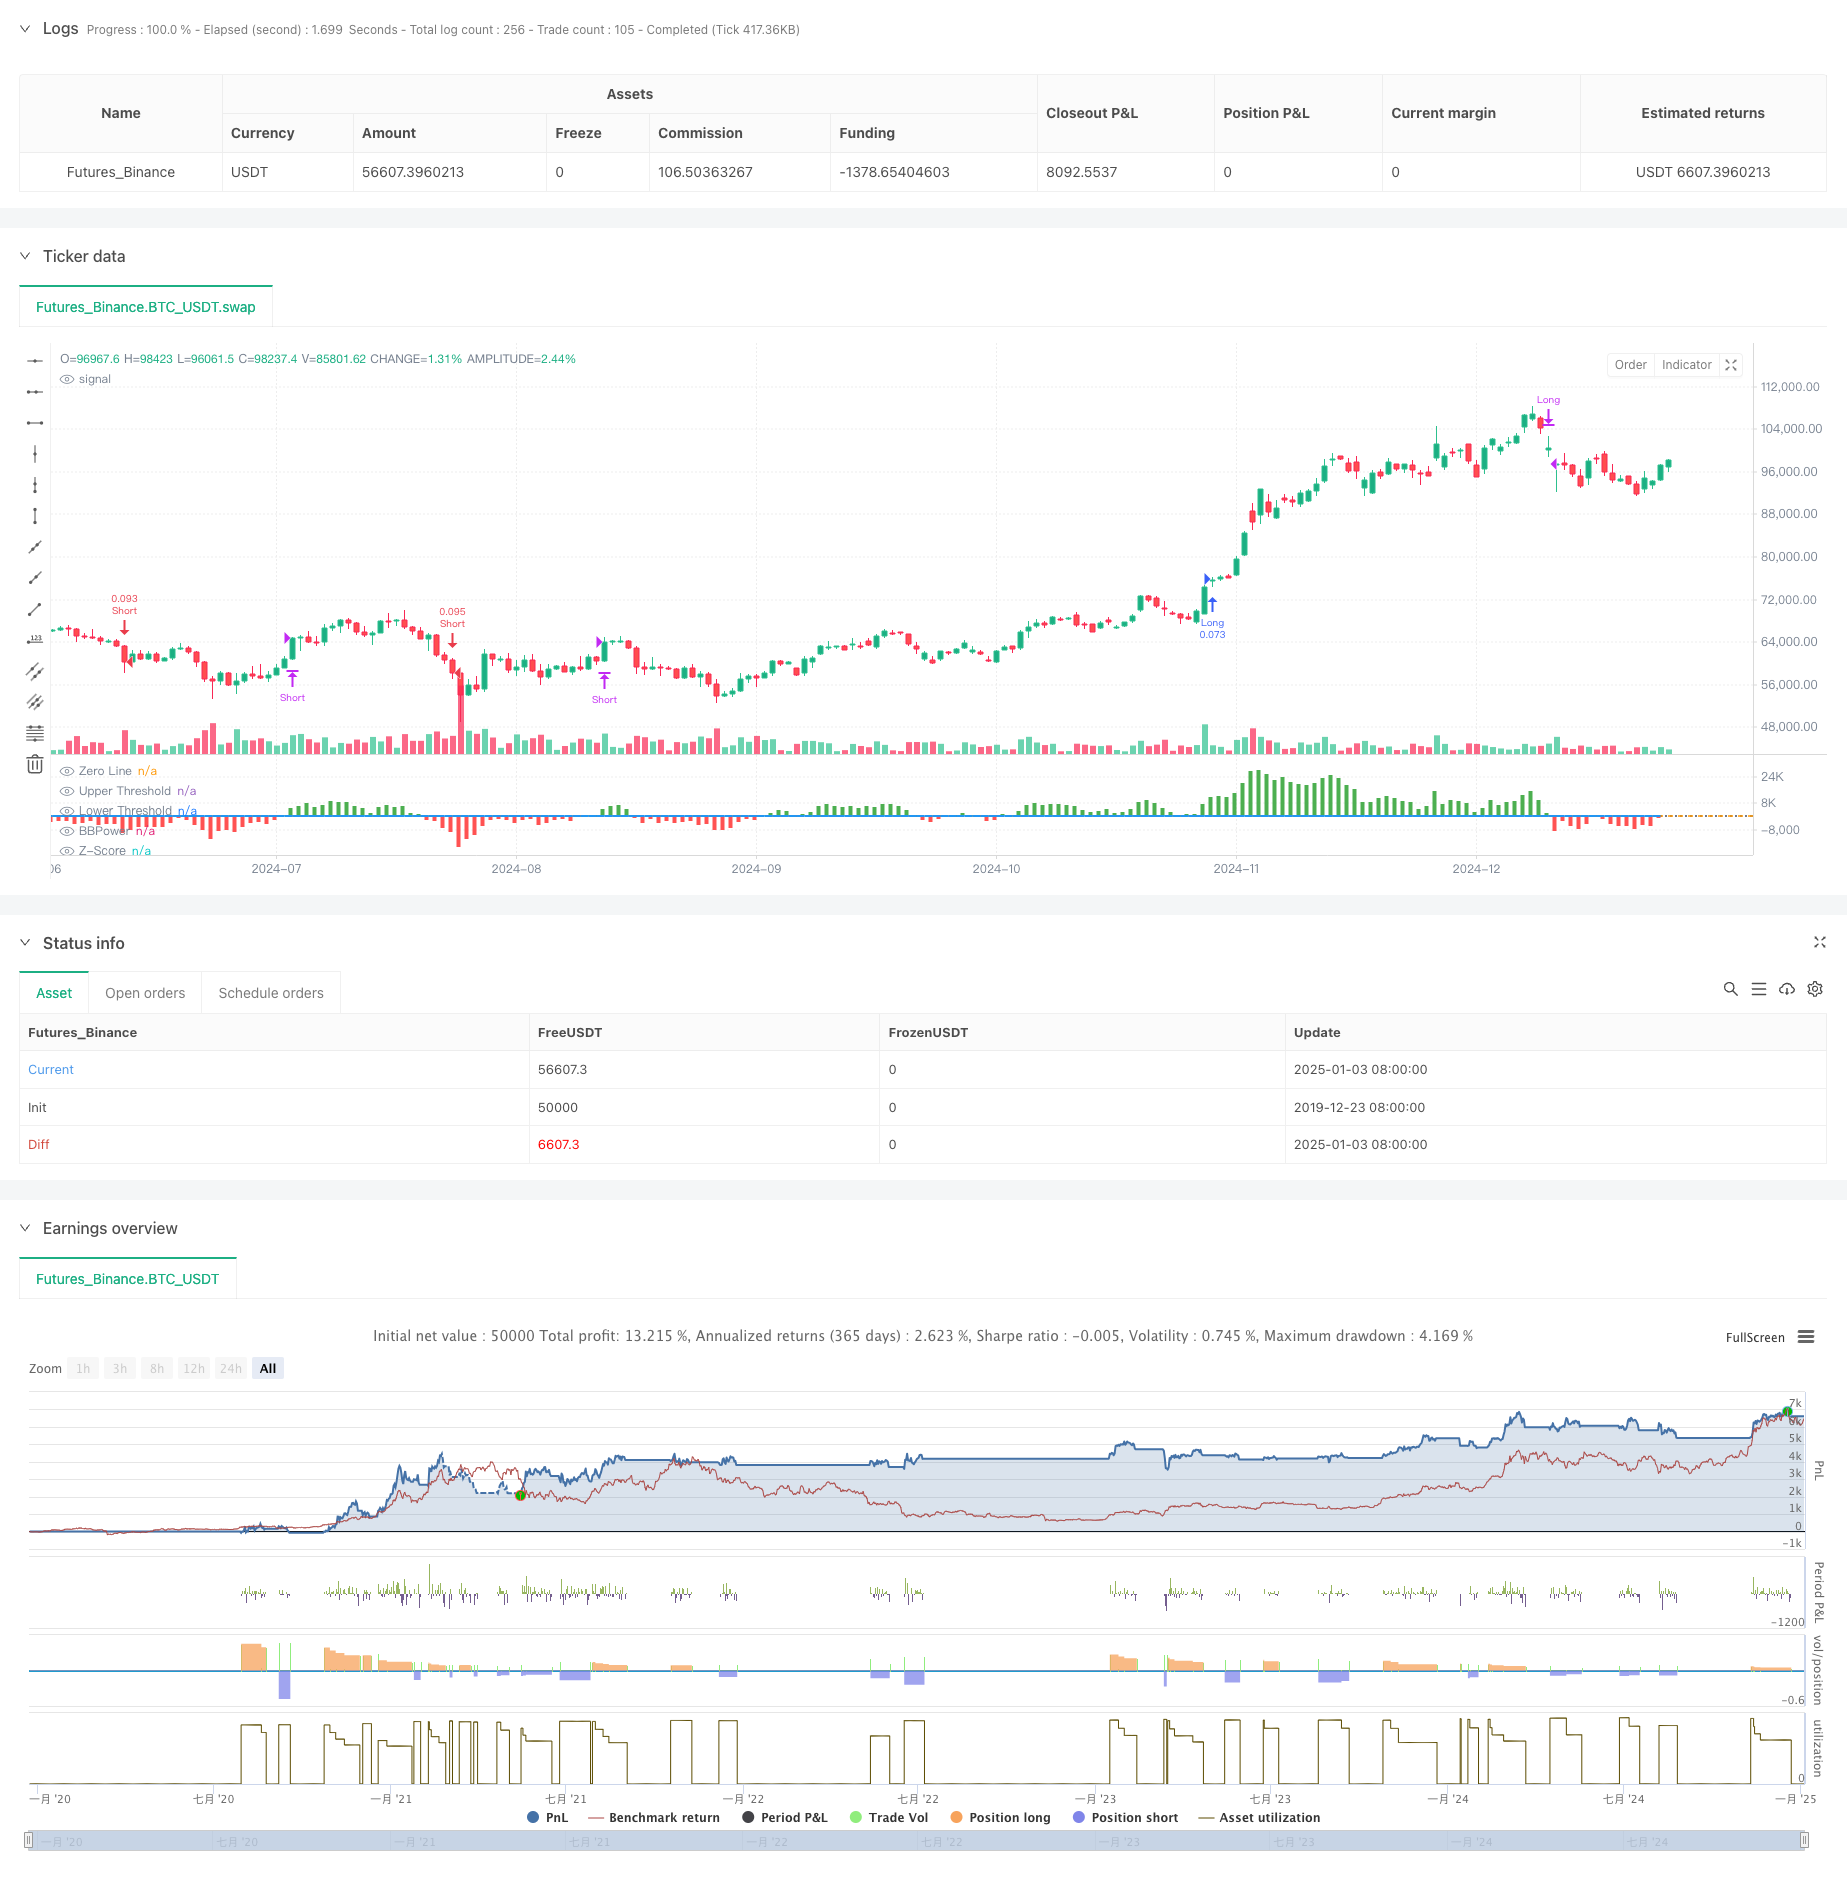
개요
이 전략은 Bull Bear Power 지표와 거래량 백분위수를 기반으로 한 다단계 동적 이익 실현 시스템을 결합한 양적 거래 전략입니다. 이 전략은 가격, 거래량, 모멘텀과 같은 다차원 데이터를 분석하여 높은 적응성과 위험 통제력이 있는 거래 시스템을 구축합니다. 핵심 로직은 BBP 지표의 Z-Score 표준화된 값을 거래 신호의 트리거 조건으로 사용하고, 볼륨 백분위수 분석을 결합하여 이익 실현 수준을 동적으로 조정함으로써 다양한 시장 변동성 상태를 정확하게 파악하는 것입니다.
전략 원칙
전략의 핵심 계산에는 다음과 같은 핵심 부분이 포함됩니다.
- BBP 지표 계산: 최고가와 EMA의 차이(상승 파워)와 최저가와 EMA의 차이(하락 파워)의 합을 계산하여 시장 파워 비교를 측정합니다.
- Z-점수 표준화: BBP 값은 현재 시장 강도의 편차 수준을 결정하기 위해 표준화됩니다.
- 거래량 분석: 이동 평균을 기준으로 현재 거래량을 계산하여 시장 활동을 파악합니다.
- 분위수 분석: 시장 상황의 확률 분포를 결정할 목적으로 과거 가격과 거래량의 분위수를 계산합니다.
- 동적 이익 실현: ATR, 거래량 백분위수, 가격 백분위수의 종합 점수에 따라 이익 실현 거리를 동적으로 조정합니다.
전략적 이점
- 다차원 분석: 가격 추세, 거래량, 시장 위치를 종합적으로 고려하여 보다 포괄적인 시장 관점을 제공합니다.
- 강력한 적응성: 동적으로 조정되는 수익 실현 메커니즘을 통해 다양한 시장 환경에 적응할 수 있습니다.
- 위험 분산: 다양한 가격 수준에서 이익을 실현하기 위해 다단계 이익 실현 전략을 채택합니다.
- 확률적 이점: Z-점수와 분위수 분석을 통해 통계적으로 유의미한 이점이 있습니다.
- 확장성: 정책 프레임워크는 확장성이 뛰어나며 필요에 따라 새로운 분석 차원을 추가할 수 있습니다.
전략적 위험
- 매개변수 민감성: 전략에는 여러 매개변수가 포함되어 있으며, 다양한 시장 환경에 맞게 최적화되어야 합니다.
- 시장 환경에 따른 의존성: 극심한 변동성이나 추세 변화 기간에는 성과가 좋지 않을 수 있습니다.
- 실행 슬리피지: 다단계 이익실현 주문은 실행 슬리피지에 직면할 수 있으며, 이는 실제 수익에 영향을 미칩니다.
- 계산 복잡성: 여러 지표를 실시간으로 계산하면 특정 시스템 부하가 발생할 수 있습니다.
- 거짓 신호 위험: 횡보 시장에서는 거짓 거래 신호가 생성될 수 있습니다.
최적화 방향
- 매개변수 적응: 기계 학습 방법을 도입하여 매개변수의 자동 최적화를 달성합니다.
- 시장 예측: 시장 환경 분류 모듈을 추가하여 불리한 거래 환경을 사전에 식별합니다.
- 손실 최적화: 동적 손실 최적화 메커니즘을 도입하여 위험 관리의 정확성을 향상시킵니다.
- 신호 필터링: 거짓 신호를 줄이기 위해 트렌드 강도 필터를 추가합니다.
- 포지션 관리: 포지션 할당 알고리즘을 최적화하고 자본 사용의 효율성을 향상시킵니다.
요약하다
이 전략은 전통적인 BBP 지표와 현대적인 양적 분석 방법을 결합하여 견고한 이론적 토대와 강력한 실용성을 갖춘 거래 시스템을 구축합니다. 다단계 수익 실현과 역동적인 조정 메커니즘을 통해 수익과 위험 간의 더 나은 균형이 달성됩니다. 매개변수 최적화에는 어느 정도 어려움이 있지만, 전략 프레임워크의 확장성 덕분에 후속 최적화를 위한 충분한 여지를 제공합니다. 실제 적용에서는 거래자에게 특정 시장 특성과 자신의 위험 선호도에 따라 목표 조정을 하는 것이 좋습니다.
전략 소스 코드
/*backtest
start: 2019-12-23 08:00:00
end: 2025-01-04 08:00:00
period: 1d
basePeriod: 1d
exchanges: [{"eid":"Futures_Binance","currency":"BTC_USDT"}]
*/

// This Pine Script™ code is subject to the terms of the Mozilla Public License 2.0 at https://mozilla.org/MPL/2.0/
// © PresentTrading

// The BBP Strategy with Volume-Percentile TP by PresentTrading emerges as a sophisticated approach that integrates multiple analytical layers to enhance trading precision and profitability.
// Unlike traditional strategies that rely solely on price movements or volume indicators, this strategy synergizes Bollinger Bands Power (BBP) with volume percentile analysis to determine optimal entry and exit points. Additionally, it employs a dynamic take-profit mechanism based on ATR (Average True Range) multipliers adjusted by volume and percentile factors, ensuring adaptability to varying market conditions.
// This multi-faceted approach not only enhances signal accuracy but also optimizes risk management, setting it apart from conventional trading methodologies.

//@version=5
strategy("BBP Strategy with Volume-Percentile TP - Strategy [presentTrading] ", overlay=false, precision=3, commission_value= 0.1, commission_type=strategy.commission.percent, slippage= 1, currency=currency.USD, default_qty_type = strategy.percent_of_equity, default_qty_value = 10, initial_capital=10000)


// ————————
// Bull Bear Power Strategy Settings
// ————————
lengthInput = input.int(21, "EMA Length")
zLength     = input.int(252, "Z-Score Length")
zThreshold  = input.float(1.618, "Z-Score Threshold")

// ————————
// Take Profit Settings
// ————————
tp_group = "Take Profit Settings"
// Enable/disable take profit function
useTP = input.bool(true, "Use Take Profit", group=tp_group)

// === ATR Base Settings ===
// ATR calculation period for determining base price movement range
baseAtrLength = input.int(20, "ATR Period", minval=1, group=tp_group, tooltip="ATR period for calculating base price movement range. Shorter periods are more sensitive to recent volatility")

// === Take Profit Multiplier Settings ===
// First take profit ATR multiplier, usually the most conservative target
atrMult1 = input.float(1.618, "TP1 ATR Multiplier", minval=0.1, step=0.1, group=tp_group, tooltip="First take profit level ATR multiplier, recommended 1.5-2.0")
// Second take profit ATR multiplier, medium profit target
atrMult2 = input.float(2.382, "TP2 ATR Multiplier", minval=0.1, step=0.1, group=tp_group, tooltip="Second take profit level ATR multiplier, recommended 2.5-3.0")
// Third take profit ATR multiplier, most aggressive target
atrMult3 = input.float(3.618, "TP3 ATR Multiplier", minval=0.1, step=0.1, group=tp_group, tooltip="Third take profit level ATR multiplier, recommended 4.0-5.0")

// === Position Size Allocation ===
// First take profit position size, usually larger for securing basic profits
tp1_size = input.float(13, "TP1 Position %", minval=1, maxval=100, group=tp_group, tooltip="Position size percentage for first take profit, recommended 30-40%")
// Second take profit position size, medium allocation
tp2_size = input.float(13, "TP2 Position %", minval=1, maxval=100, group=tp_group, tooltip="Position size percentage for second take profit, recommended 30-40%")
// Third take profit position size, usually smaller for catching larger moves
tp3_size = input.float(13, "TP3 Position %", minval=1, maxval=100, group=tp_group, tooltip="Position size percentage for third take profit, recommended 20-30%")

// ————————
// Volume Analysis Settings
// ————————
vol_group = "Volume Analysis Settings"
// Volume MA period for determining relative volume levels
vol_period = input.int(100, "Volume MA Period", minval=1, group=vol_group, tooltip="Period for calculating volume moving average, recommended 20-30")

// === Volume Level Thresholds ===
// High volume threshold relative to MA
vol_high = input.float(2.0, "High Volume Multiplier", minval=1.0, step=0.1, group=vol_group, tooltip="High volume threshold multiplier, typically 2x MA or above")
// Medium volume threshold
vol_med = input.float(1.5, "Medium Volume Multiplier", minval=1.0, step=0.1, group=vol_group, tooltip="Medium volume threshold multiplier, typically around 1.5x MA")
// Low volume threshold
vol_low = input.float(1.0, "Low Volume Multiplier", minval=0.5, step=0.1, group=vol_group, tooltip="Low volume threshold multiplier, typically around 1x MA")

// === Volume Adjustment Factors ===
// High volume adjustment factor, usually extends take profit targets
vol_high_mult = input.float(1.5, "High Volume Factor", minval=0.1, step=0.1, group=vol_group, tooltip="Take profit adjustment factor for high volume")
// Medium volume adjustment factor
vol_med_mult = input.float(1.3, "Medium Volume Factor", minval=0.1, step=0.1, group=vol_group, tooltip="Take profit adjustment factor for medium volume")
// Low volume adjustment factor
vol_low_mult = input.float(1.0, "Low Volume Factor", minval=0.1, step=0.1, group=vol_group, tooltip="Take profit adjustment factor for low volume")

// ————————
// Percentile Analysis Settings
// ————————
perc_group = "Percentile Analysis Settings"
// Percentile calculation period for evaluating price position
perc_period = input.int(100, "Percentile Period", minval=20, group=perc_group, tooltip="Historical period for percentile calculations, recommended 100-200")

// === Percentile Thresholds ===
// High percentile threshold, typically indicates relative high levels
perc_high = input.float(90, "High Percentile", minval=50, maxval=100, group=perc_group, tooltip="High level percentile threshold, typically above 90")
// Medium percentile threshold
perc_med = input.float(80, "Medium Percentile", minval=50, maxval=100, group=perc_group, tooltip="Medium level percentile threshold, typically around 80")
// Low percentile threshold
perc_low = input.float(70, "Low Percentile", minval=0, maxval=100, group=perc_group, tooltip="Low level percentile threshold, typically around 70")

// === Percentile Adjustment Factors ===
// High percentile adjustment factor
perc_high_mult = input.float(1.5, "High Percentile Factor", minval=0.1, step=0.1, group=perc_group, tooltip="Take profit adjustment factor for high percentile levels")
// Medium percentile adjustment factor
perc_med_mult = input.float(1.3, "Medium Percentile Factor", minval=0.1, step=0.1, group=perc_group, tooltip="Take profit adjustment factor for medium percentile levels")
// Low percentile adjustment factor
perc_low_mult = input.float(1.0, "Low Percentile Factor", minval=0.1, step=0.1, group=perc_group, tooltip="Take profit adjustment factor for low percentile levels")


// ————————
// Core Bull Bear Power Calculations
// ————————
emaClose  = ta.ema(close, lengthInput)
bullPower = high - emaClose
bearPower = low  - emaClose
bbp       = bullPower + bearPower

bbp_mean  = ta.sma(bbp, zLength)
bbp_std   = ta.stdev(bbp, zLength)
zscore    = (bbp - bbp_mean) / bbp_std

// ————————
// Volume & Percentile Analysis
// ————————
// 成交量分析
vol_sma = ta.sma(volume, vol_period)
vol_mult = volume / vol_sma

// 百分位數計算
calcPercentile(src) =>
    var values = array.new_float(0)
    array.unshift(values, src)
    if array.size(values) > perc_period
        array.pop(values)
    array.size(values) > 0 ? array.percentrank(values, array.size(values)-1) * 100 : 50

price_perc = calcPercentile(close)
vol_perc = calcPercentile(volume)

// 止盈動態調整系數計算
getTpFactor() =>
    vol_score = vol_mult > vol_high ? vol_high_mult : vol_mult > vol_med ? vol_med_mult : vol_mult > vol_low ? vol_low_mult : 0.8
    price_score = price_perc > perc_high ? perc_high_mult :price_perc > perc_med ? perc_med_mult :price_perc > perc_low ? perc_low_mult : 0.8
    math.avg(vol_score, price_score)

// ————————
// Entry/Exit Logic
// ————————
longCondition  = ta.crossover(zscore,  zThreshold)
shortCondition = ta.crossunder(zscore, -zThreshold)
exitLongCondition  = ta.crossunder(zscore, 0)
exitShortCondition = ta.crossover(zscore,  0)

if (barstate.isconfirmed)
    if longCondition
        strategy.entry("Long", strategy.long)
    if shortCondition
        strategy.entry("Short", strategy.short)
    if exitLongCondition
        strategy.close("Long")
    if exitShortCondition
        strategy.close("Short")

// ————————
// Take Profit Execution
// ————————
if useTP and strategy.position_size != 0
    base_move = ta.atr(baseAtrLength)
    tp_factor = getTpFactor()
    is_long = strategy.position_size > 0
    entry_price = strategy.position_avg_price

    if is_long
        tp1_price = entry_price + (base_move * atrMult1 * tp_factor)
        tp2_price = entry_price + (base_move * atrMult2 * tp_factor)
        tp3_price = entry_price + (base_move * atrMult3 * tp_factor)

        strategy.exit("TP1", "Long", qty_percent=tp1_size, limit=tp1_price)
        strategy.exit("TP2", "Long", qty_percent=tp2_size, limit=tp2_price)
        strategy.exit("TP3", "Long", qty_percent=tp3_size, limit=tp3_price)
    else
        tp1_price = entry_price - (base_move * atrMult1 * tp_factor)
        tp2_price = entry_price - (base_move * atrMult2 * tp_factor)
        tp3_price = entry_price - (base_move * atrMult3 * tp_factor)

        strategy.exit("TP1", "Short", qty_percent=tp1_size, limit=tp1_price)
        strategy.exit("TP2", "Short", qty_percent=tp2_size, limit=tp2_price)
        strategy.exit("TP3", "Short", qty_percent=tp3_size, limit=tp3_price)

// ————————
// Plotting
// ————————
plot(bbp, color=bbp >= 0 ? color.new(color.green, 0) : color.new(color.red, 0),
     title="BBPower", style=plot.style_columns)
hline(0, "Zero Line", color=color.gray, linestyle=hline.style_dotted)
plot(zscore, title="Z-Score", color=color.blue, linewidth=2)
hline(zThreshold, "Upper Threshold", color=color.orange, linestyle=hline.style_dashed)
hline(-zThreshold, "Lower Threshold", color=color.orange, linestyle=hline.style_dashed)