
1
Follow
1781
Followers
개요
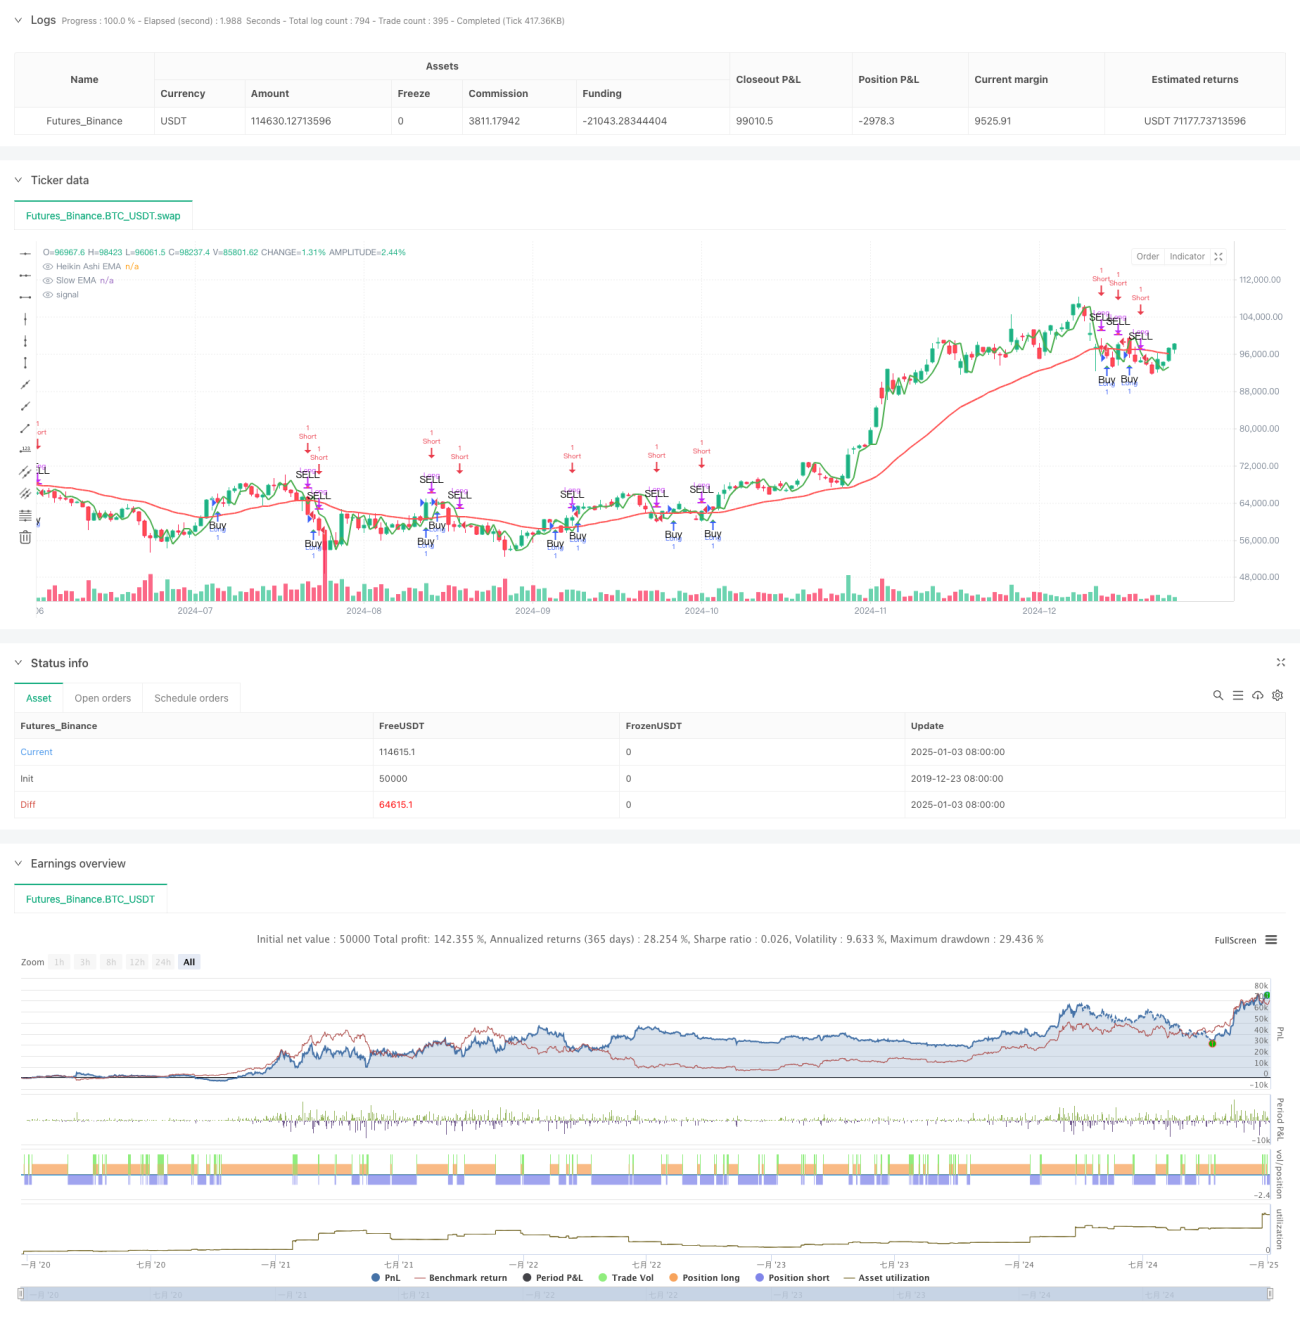
이 전략은 평활화된 캔들스틱(하이킨-아시)과 지수 이동 평균(EMA)의 교차를 기반으로 하는 다중 기간 추세 추종 시스템입니다. 하이킨-아시 캔들스틱의 평활화 특성과 다양한 기간에 걸친 이동평균의 추세 추적 능력을 결합하고, MACD 지표를 필터로 사용하면 시장 추세를 정확하게 포착할 수 있습니다. 이 전략은 시간대 계층적 설계를 채택하고 60분, 180분, 15분의 세 가지 시간대에 대해 신호 계산과 검증을 수행합니다.
전략 원칙
전략의 핵심 논리는 다음과 같은 핵심 부분으로 구성됩니다.
- 하이킨-아시 촛대 계산: 시작가, 고가, 저가, 종가를 계산하는 특별한 방법을 통해 원시 가격 데이터를 매끄럽게 처리하고 시장 노이즈를 줄입니다.
- 다중 시간 기간 EMA 시스템: 하이킨-아시 EMA는 180분 주기로 계산되며 60분 주기의 느린 EMA와 크로스오버 신호 시스템을 형성합니다.
- MACD 필터: 거래 신호의 유효성을 확인하기 위해 15분 기간의 MACD 지표를 계산합니다.
- 신호 생성 규칙: 빠른 Heikin-Ashi EMA가 느린 EMA를 위로 교차하고 MACD 지표가 확인되면(활성화된 경우), 롱 신호가 생성됩니다. 그렇지 않으면 숏 신호가 생성됩니다.
전략적 이점
- 강력한 신호 평활도: Heikin-Ashi 캔들스틱의 평활화 특성은 거짓 신호를 효과적으로 줄일 수 있습니다.
- 다양한 시간대 검증: 서로 다른 시간대를 조화롭게 사용하면 신호의 신뢰성이 향상됩니다.
- 우수한 추세 추적 효과: EMA 크로스오버 시스템을 통해 중기 및 장기 추세를 효과적으로 포착할 수 있습니다.
- 유연한 필터링 메커니즘: 선택 가능한 MACD 필터는 추가적인 신호 확인을 제공합니다.
- 강력한 매개변수 조정성: 여러 주요 매개변수를 다양한 시장 특성에 따라 최적화할 수 있습니다.
전략적 위험
- 변동성이 큰 시장의 위험: 횡보장이고 변동성이 큰 시장에서는 거짓 돌파 신호가 자주 발생할 수 있습니다.
- 지연 위험: 여러 시간대에 걸친 검증으로 인해 진입 시점이 약간 지연될 수 있습니다.
- 매개변수 민감도: 매개변수 조합이 다르면 전략 성과에 큰 차이가 생길 수 있습니다.
- 시장 환경 의존성: 전략은 추세가 강한 시장에서는 더 좋은 성과를 거두지만, 다른 시장 환경에서는 성과가 좋지 않을 수 있습니다.
전략 최적화 방향
- 변동성 필터링 추가: ATR이나 볼린저 밴드와 같은 지표를 도입하여 시장 변동성을 판단합니다.
- 최적화된 기간 선택: 특정 거래 상품의 특성에 따라 기간 조합을 조정할 수 있습니다.
- 손절매 메커니즘을 개선합니다. 변동성에 따라 추적 손절매 또는 동적 손절매를 추가합니다.
- 포지션 관리 추가: 신호 강도와 시장 변동성에 따라 포지션 크기를 동적으로 조정합니다.
- 시장 환경 판단 추가: 다양한 시장 환경을 구분하기 위해 추세 강도 지표를 추가합니다.
요약하다
이 전략은 여러 기간의 하이킨-아시와 EMA 시스템을 MACD 필터와 결합하여 완전한 추세 추종 거래 시스템을 구축합니다. 전략 설계는 신호의 신뢰성과 시스템의 안정성을 충분히 고려하며, 매개변수 최적화와 위험 관리 메커니즘 개선을 통해 다양한 시장 환경에 적응할 수 있습니다. 이 전략의 핵심적인 장점은 신호의 원활함과 다중 검증 메커니즘에 있지만, 동시에 변동성 있는 시장의 위험과 매개변수 최적화 문제에도 주의해야 합니다.
Source
Pine
/*backtest
start: 2019-12-23 08:00:00
end: 2025-01-04 08:00:00
period: 1d
basePeriod: 1d
exchanges: [{"eid":"Futures_Binance","currency":"BTC_USDT"}]
*/

// This Pine Script™ code is subject to the terms of the Mozilla Public License 2.0 at https://mozilla.org/MPL/2.0/
// © tradingbauhaus

//@version=5Strategy parameters
Related strategies
Comment
All comments (0)
No data
- 1