동적 랜덤 패턴을 기반으로 한 다중 지표 최적화 KDJ 트렌드 크로스오버 전략 거래 시스템

KDJ RSV SL TP ATR
생성 날짜: 2025-01-06 16:23:38 마지막으로 수정됨: 2025-01-06 16:23:38
복사: 1 클릭수: 500
avatar of ChaoZhang ChaoZhang
1
집중하다
1617
수행원

동적 랜덤 패턴을 기반으로 한 다중 지표 최적화 KDJ 트렌드 크로스오버 전략 거래 시스템

개요

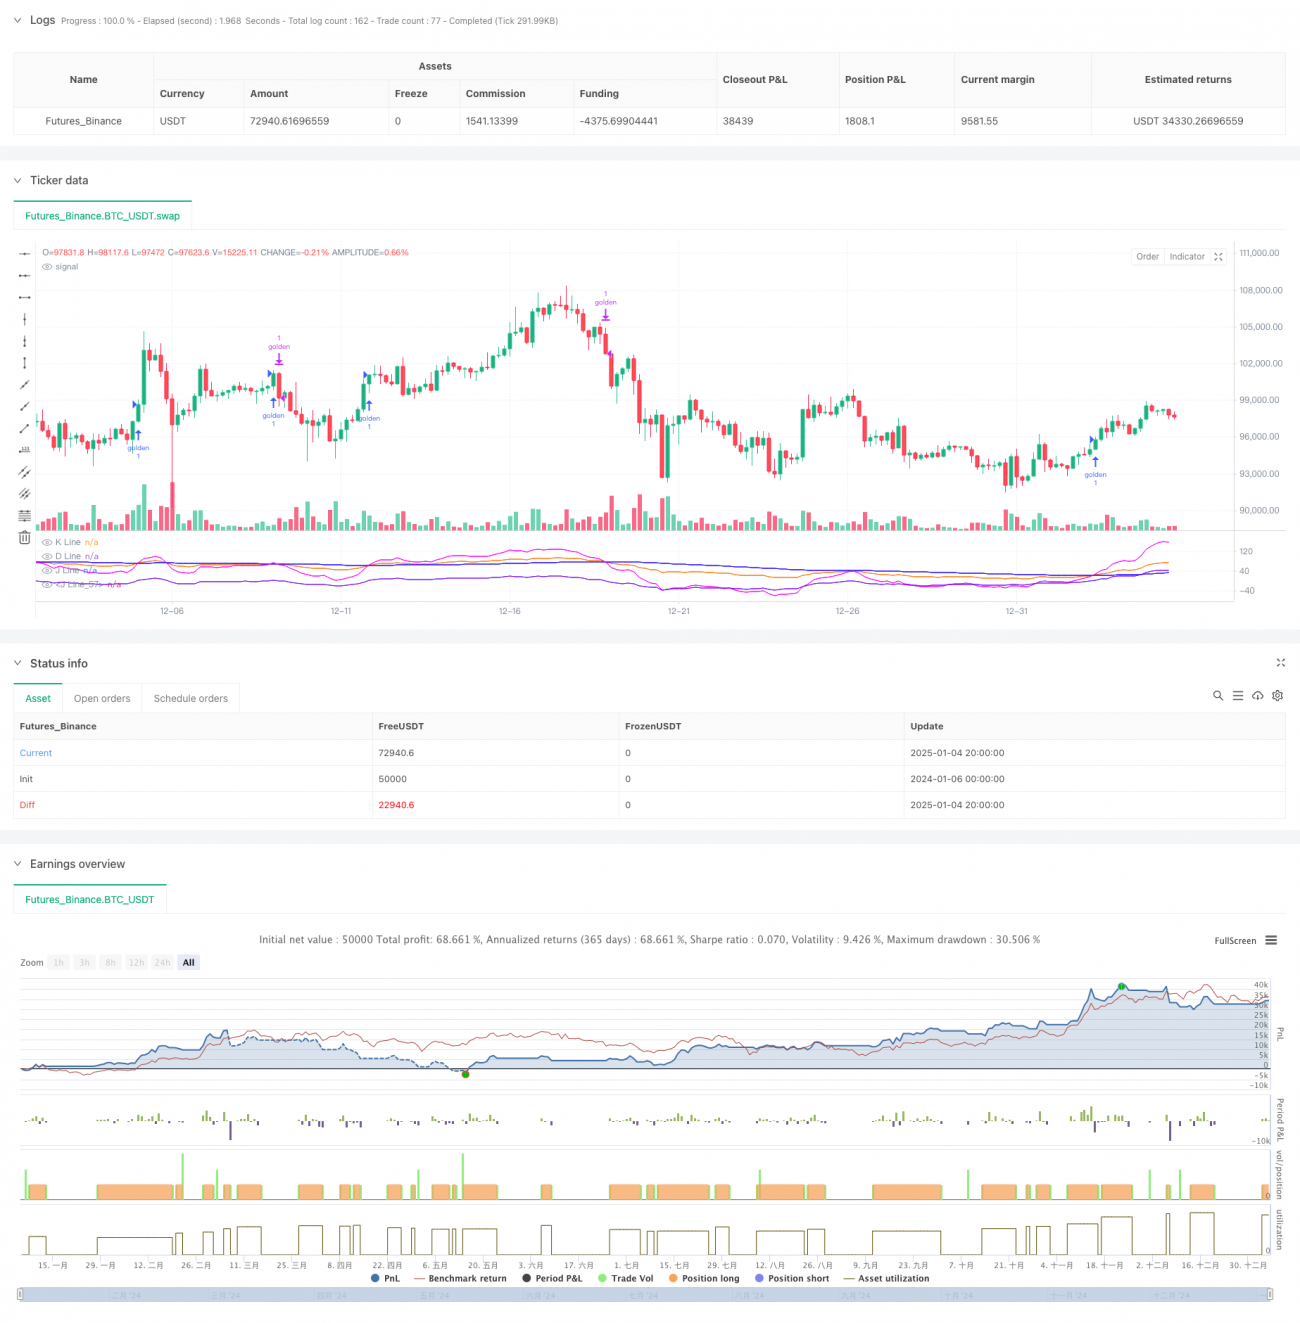
이 전략은 KDJ 지표를 기반으로 한 고급 거래 시스템으로, K라인, D라인, J라인의 교차 패턴에 대한 심층 분석을 수행하여 시장 동향을 파악합니다. 이 전략은 맞춤형 BCWSMA 평활화 알고리즘을 통합하고 확률적 지표의 계산을 최적화하여 신호의 신뢰성을 향상시킵니다. 시스템은 손절매 및 추적 손절매 기능을 포함한 엄격한 위험 관리 메커니즘을 채택하여 건전한 자금 관리를 실현합니다.

전략 원칙

전략의 핵심 논리는 다음과 같은 핵심 요소에 기초합니다.

  1. KDJ 지표는 지표의 부드러움과 안정성을 개선한 맞춤형 BCWSMA(가중 이동 평균) 알고리즘을 사용하여 계산됩니다.
  2. RSV(미숙한 난수 값)를 계산하면 가격이 0~100 사이의 값으로 변환되어 최고점과 최저점 사이의 가격 위치를 더 잘 반영할 수 있습니다.
  3. 다중 확인을 통해 거래 신호의 정확도를 향상시키기 위해 고유한 J-라인 및 J5-라인(파생 지표) 교차 검증 메커니즘을 설계했습니다.
  4. 연속성에 기반한 추세 확인 메커니즘이 확립되었으며, 추세의 타당성을 확인하려면 J선이 3일 연속으로 D선 위에 있어야 합니다.
  5. 퍼센티지 스톱로스 및 트레일링 스톱로스를 통합한 복합 리스크 관리 시스템

전략적 이점

  1. 고급 신호 생성 메커니즘: 여러 기술 지표의 교차 검증을 통해 잘못된 신호의 영향이 크게 감소합니다.
  2. 완벽한 위험 통제: 고정 손절매 및 이동 손절매를 포함한 다단계 위험 통제 메커니즘을 채택하여 하방 위험을 효과적으로 통제합니다.
  3. 강력한 매개변수 조정성: KDJ 주기, 신호 평활화 계수 등과 같은 주요 매개변수는 시장 상황에 따라 유연하게 조정 가능합니다.
  4. 높은 계산 효율성: 최적화된 BCWSMA 알고리즘을 사용하면 계산 복잡성이 줄어들고 전략 실행 효율성이 향상됩니다.
  5. 우수한 적응성: 다양한 시장 환경에 적응하고 매개변수 조정을 통해 전략 성과를 최적화할 수 있습니다.

전략적 위험

  1. 변동성 있는 시장의 위험: 옆으로 변동성이 있는 시장에서는 빈번하게 잘못된 돌파 신호가 발생하여 거래 비용이 증가할 수 있습니다.
  2. 지연 위험: 이동 평균 평활화를 사용하기 때문에 신호가 어느 정도 지연될 수 있습니다.
  3. 매개변수 민감도: 전략의 효과는 매개변수 설정에 민감합니다. 부적절한 매개변수 설정은 전략의 효과를 크게 감소시킬 수 있습니다.
  4. 시장 환경 의존성: 특정 시장 환경에서는 전략 성과가 이상적이지 않을 수 있습니다.

전략 최적화 방향

  1. 신호 필터링 메커니즘 최적화: 거래량, 변동성 등의 보조 지표를 도입하여 신호의 신뢰성을 향상시킬 수 있습니다.
  2. 동적 매개변수 조정: 시장 변동에 따라 KDJ 매개변수 및 손절매 매개변수를 동적으로 조정합니다.
  3. 시장 환경 식별: 다양한 시장 환경에서 다양한 거래 전략을 채택하기 위해 시장 환경 판단 모듈을 추가합니다.
  4. 강화된 위험 관리: 최대 인출 제어 및 포지션 유지 시간 제한과 같은 추가 위험 관리 조치를 추가할 수 있습니다.
  5. 성능 최적화: BCWSMA 알고리즘을 더욱 최적화하여 계산 효율성을 개선합니다.

요약하다

이 전략은 기술 지표와 엄격한 위험 관리를 혁신적으로 결합하여 완전한 거래 시스템을 구축합니다. 이 전략의 핵심적인 장점은 다중 신호 확인 메커니즘과 완벽한 위험 관리 시스템에 있지만, 매개변수 최적화와 시장 환경에 대한 적응성과 같은 문제에도 주의를 기울여야 합니다. 지속적인 최적화와 개선을 통해 이 전략은 다양한 시장 환경에서도 안정적인 성과를 유지할 것으로 기대됩니다.

전략 소스 코드
/*backtest
start: 2024-01-06 00:00:00
end: 2025-01-05 00:00:00
period: 4h
basePeriod: 4h
exchanges: [{"eid":"Futures_Binance","currency":"BTC_USDT"}]
*/

// This Pine Script™ code is subject to the terms of the Mozilla Public License 2.0 at https://mozilla.org/MPL/2.0/
// © hexu90

//@version=6

// Date Range
// STEP 1. Create inputs that configure the backtest's date range
useDateFilter = input.bool(true, title="Filter Date Range of Backtest",
     group="Backtest Time Period")
backtestStartDate = input(timestamp("1 Jan 2020"), 
     title="Start Date", group="Backtest Time Period",
     tooltip="This start date is in the time zone of the exchange " + 
     "where the chart's instrument trades. It doesn't use the time " + 
     "zone of the chart or of your computer.")
backtestEndDate = input(timestamp("15 Dec 2024"),
     title="End Date", group="Backtest Time Period",
     tooltip="This end date is in the time zone of the exchange " + 
     "where the chart's instrument trades. It doesn't use the time " + 
     "zone of the chart or of your computer.")
// STEP 2. See if current bar falls inside the date range
inTradeWindow = true

//KDJ strategy
// indicator("My Customized KDJ", shorttitle="KDJ")
strategy("My KDJ Strategy", overlay = false)

// Input parameters
ilong = input(90, title="Period")
k_isig = input(3, title="K Signal")
d_isig = input(30, title="D Signal")

// Custom BCWSMA calculation outside the function
bcwsma(source, length, weight) =>
    var float prev = na  // Persistent variable to store the previous value
    if na(prev)
        prev := source  // Initialize on the first run
    prev := (weight * source + (length - weight) * prev) / length
    prev

// Calculate KDJ
c = close
h = ta.highest(high, ilong)
l = ta.lowest(low, ilong)
RSV = 100 * ((c - l) / (h - l))
pK = bcwsma(RSV, k_isig, 1)
pD = bcwsma(pK, d_isig, 1)
pJ = 3 * pK - 2 * pD

pJ1 = 0
pJ2 = 80
pJ5 = (pJ-pK)-(pK-pD)

// Plot the K, D, J lines with colors
plot(pK, color=color.rgb(251, 121, 8), title="K Line")  // Orange
plot(pD, color=color.rgb(30, 0, 255), title="D Line")  // Blue
plot(pJ, color=color.new(color.rgb(251, 0, 255), 10), title="J Line")  // Pink with transparency
plot(pJ5, color=#6f03f3e6, title="J Line")  // Pink with transparency

// Background color and reference lines
// bgcolor(pJ > pD ? color.new(color.green, 75) : color.new(color.red, 75))
// hline(80, "Upper Band", color=color.gray)
// hline(20, "Lower Band", color=color.gray)

// Variables to track the conditions
var bool condition1_met = false
var int condition2_met = 0

// Condition 1: pJ drops below pJ5
if ta.crossunder(pJ, pJ5)
    condition1_met := true
    condition2_met := 0  // Reset condition 2 if pJ drops below pJ5 again

if ta.crossover(pJ, pD)
    condition2_met += 1

to_long = ta.crossover(pJ, pD)


var int consecutiveDays = 0
// Update the count of consecutive days
if pJ > pD
    consecutiveDays += 1
else
    consecutiveDays := 0

// Check if pJ has been above pD for more than 3 days
consPJacrossPD = false
if consecutiveDays > 3
    consPJacrossPD := true

// Entry condition: After condition 2, pJ crosses above pD a second time
// if condition1_met and condition2_met > 1
//     strategy.entry("golden", strategy.long, qty=1000)
//     condition1_met := false  // Reset the conditions for a new cycle
//     condition2_met = 0
// 
if ta.crossover(pJ, pD) 
    // and pD < 40 and consPJacrossPD
    // consecutiveDays == 1
    //  consecutiveDays == 3 and
    strategy.entry("golden", strategy.long, qty=1)

// to_short = 
// or ta.crossunder(pJ, 100)

// Exit condition
if ta.crossover(pD, pJ)
    strategy.close("golden", qty = 1)

// Stop loss and trailing profit
trail_stop_pct = input.float(0.5, title="Trailing Stop activation (%)", group="Exit Lonng", inline="LTS", tooltip="Trailing Treshold %")
trail_offset_pct = input.float(0.5, title="Trailing Offset (%)", group="Exit Lonng", inline="LTS", tooltip="Trailing Offset %")
trail_stop_tick = trail_stop_pct * close/100
trail_offset_tick = trail_offset_pct * close/100

sl_pct = input.float(5, title="Stop Loss", group="SL and TP", inline="LSLTP")
// tp_pct = input.float(9, title="Take Profit", group="SL and TP", inline="LSLTP")

long_sl_price = strategy.position_avg_price * (1 - sl_pct/100)
// long_tp_price = strategy.position_avg_price * (1 + tp_pct/100)

strategy.exit('golden Exit', 'golden', stop = long_sl_price)
// trail_points = trail_stop_tick, trail_offset=trail_offset_tick