
1
Follow
1781
Followers
개요
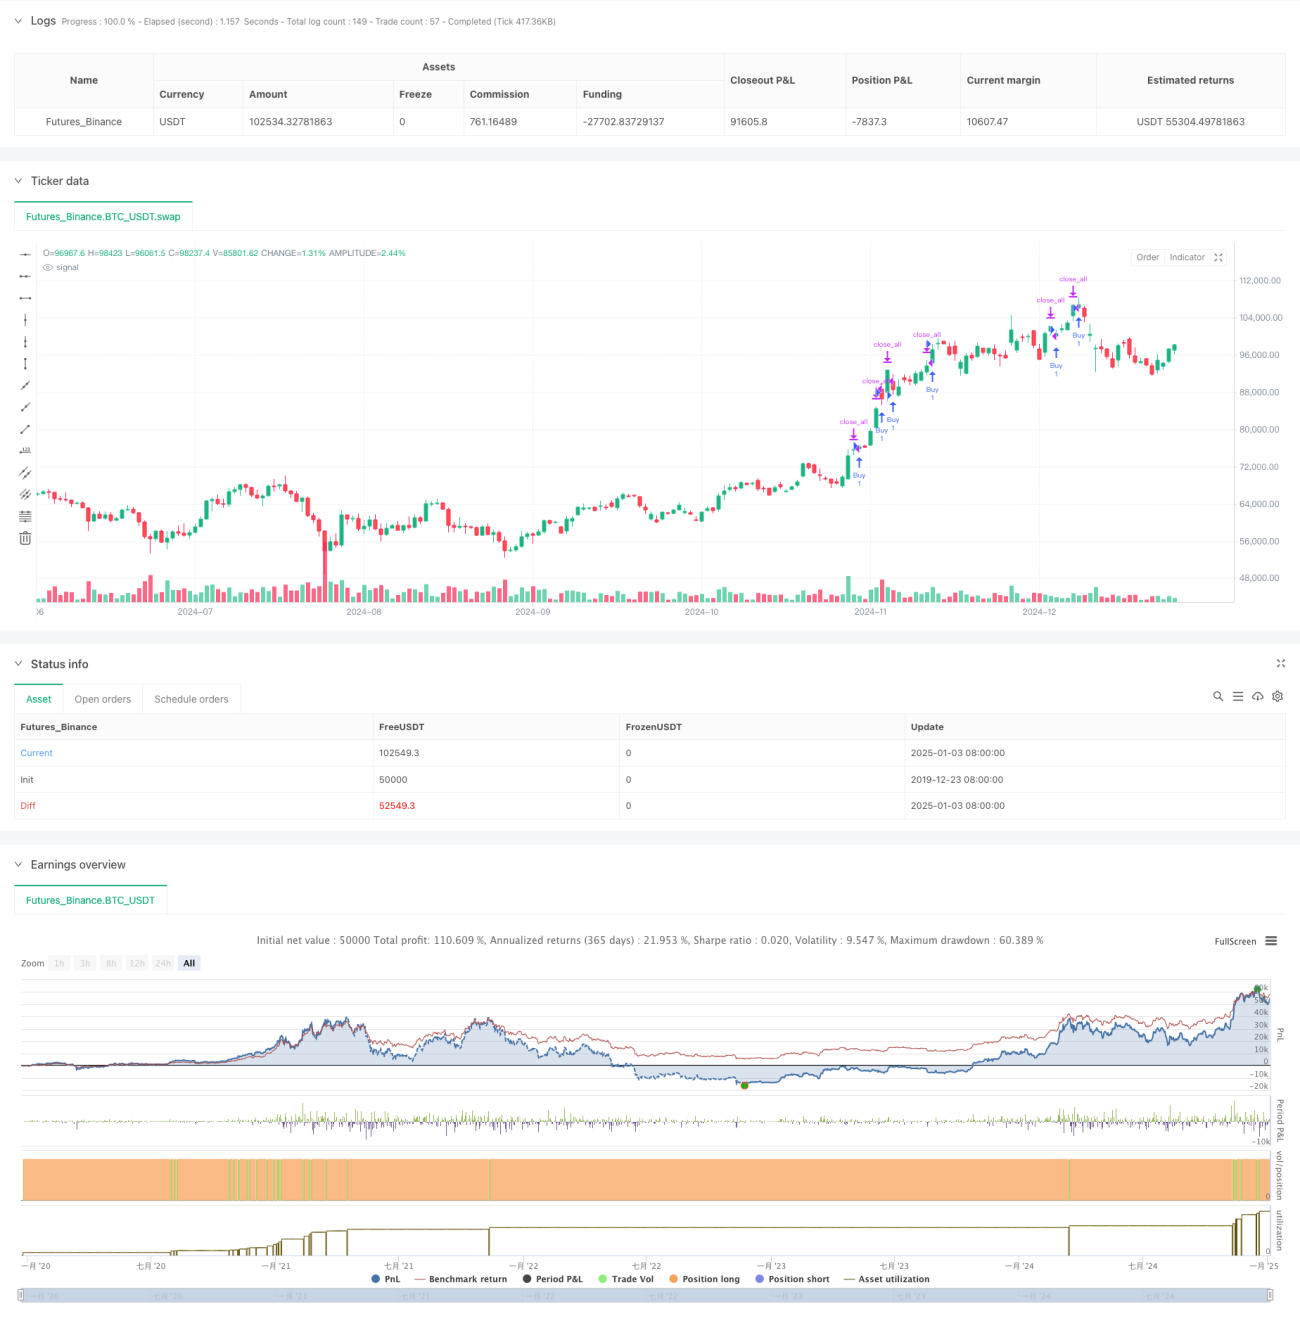
이 전략은 가격 하락 정도에 따라 포지션을 늘리고 고정된 이익 목표에 도달하면 포지션을 청산하는 그리드 트레이딩 전략입니다. 이 전략의 핵심 논리는 시장이 사전 설정된 범위까지 떨어지면 매수하고, 가격이 반등하여 목표 수익에 도달하면 전체 포지션을 마감하고, 이러한 과정을 끊임없이 반복하여 수익을 창출하는 것입니다. 이 전략은 특히 변동성이 큰 시장에서 단기 반등 기회를 포착하는 데 적합합니다.
전략 원칙
이 전략은 그리드 거래와 방향성 이익 실현의 복합 메커니즘을 사용합니다.
- 초기 포지션 개설: 설정된 시작 시간 이후, 시스템은 처음 포지션이 체결될 때 현재 가격으로 처음으로 포지션을 개설합니다.
- 포지션 추가 메커니즘: 초기 포지션 개시 가격에 비해 가격이 사전 설정된 하락률(기본값 5%)보다 더 많이 하락하면 추가 매수가 이루어집니다.
- 마감 메커니즘: 초기 개장 가격에 비해 가격이 사전 설정된 이익 목표(기본값 5%)보다 상승하면 시스템은 모든 포지션을 마감합니다.
- 통계적 추적: 시스템은 거래 건수와 누적 수익을 실시간으로 계산하여 차트에 동적으로 표시합니다.
전략적 이점
- 높은 수준의 자동화: 전략은 완전히 체계화되어 있고, 인간의 개입이 필요 없으며, 하루 24시간 지속적으로 실행할 수 있습니다.
- 위험 분산: 배치 단위로 포지션을 구축함으로써 한 번에 한 포지션을 구축하는 데 따른 위험을 효과적으로 줄일 수 있습니다.
- 명확한 이익 정지 시점: 고정된 이익 목표를 설정하고 목표에 도달하면 즉시 현금화하세요.
- 강력한 적응성: 매개변수 조정을 통해 다양한 시장 환경 및 거래 상품에 적응할 수 있습니다.
- 강력한 실행 능력: 전략적 논리가 명확하고 주관적인 감정에 영향을 받지 않습니다.
전략적 위험
- 추세 위험: 시장이 계속 하락하는 상황에서는 포지션이 계속 증가하여 손실이 더 커질 수 있습니다.
- 자금운용위험 : 합리적인 포지션 통제가 이루어지지 않을 경우, 과도한 포지션 증가로 인해 과도한 자본점유가 발생할 수 있습니다.
- 슬리피지 위험: 시장이 격렬하게 변동하는 경우 심각한 슬리피지가 발생할 수 있으며, 이는 전략 성과에 영향을 미칩니다.
- 매개변수 민감도: 전략 효과는 매개변수 설정에 민감하며, 매개변수는 다양한 시장 환경에서 시기적절하게 조정되어야 합니다.
전략 최적화 방향
- 동적 손절매: 급격한 하락을 방지하기 위해 ATR이나 변동성을 기반으로 동적 손절매 메커니즘을 추가하는 것이 좋습니다.
- 포지션 관리: 계좌 자본에 따른 동적 포지션 관리를 도입하여 자금을 보다 합리적으로 사용할 수 있습니다.
- 시장 스크리닝: 추세 판단 지표를 추가하고 추세가 뚜렷한 시장에서는 전략 운영을 중단합니다.
- 수익 목표 최적화: 시장 변동에 따라 동적으로 수익 목표를 설계하고 적응적으로 조정할 수 있습니다.
- 포지션 추가 최적화: 초기 단계에서 포지션이 과도하게 추가되는 것을 피하기 위해 점진적으로 포지션을 추가하도록 설계할 수 있습니다.
요약하다
이는 사전 설정된 하락 범위에 따라 일괄적으로 포지션을 구축하고 목표 수익에 도달하면 모든 포지션을 종료하는 간단하면서도 실용적인 그리드 트레이딩 전략입니다. 이 전략의 핵심적인 장점은 실행의 확실성과 위험 분산에 있지만, 이를 사용할 때는 시장 환경 선택과 매개변수 최적화에 주의를 기울여야 합니다. 아직 동적 손절매 추가, 포지션 관리 개선 등을 통해 전략을 최적화할 여지가 많이 있습니다. 실제 거래에 활용할 경우, 먼저 충분한 백테스팅을 실시하고, 실제 시장 상황에 맞춰 매개변수를 조정하는 것이 좋습니다.
Source
Pine
Strategy parameters
Related strategies
Comment
All comments (0)
No data
- 1