
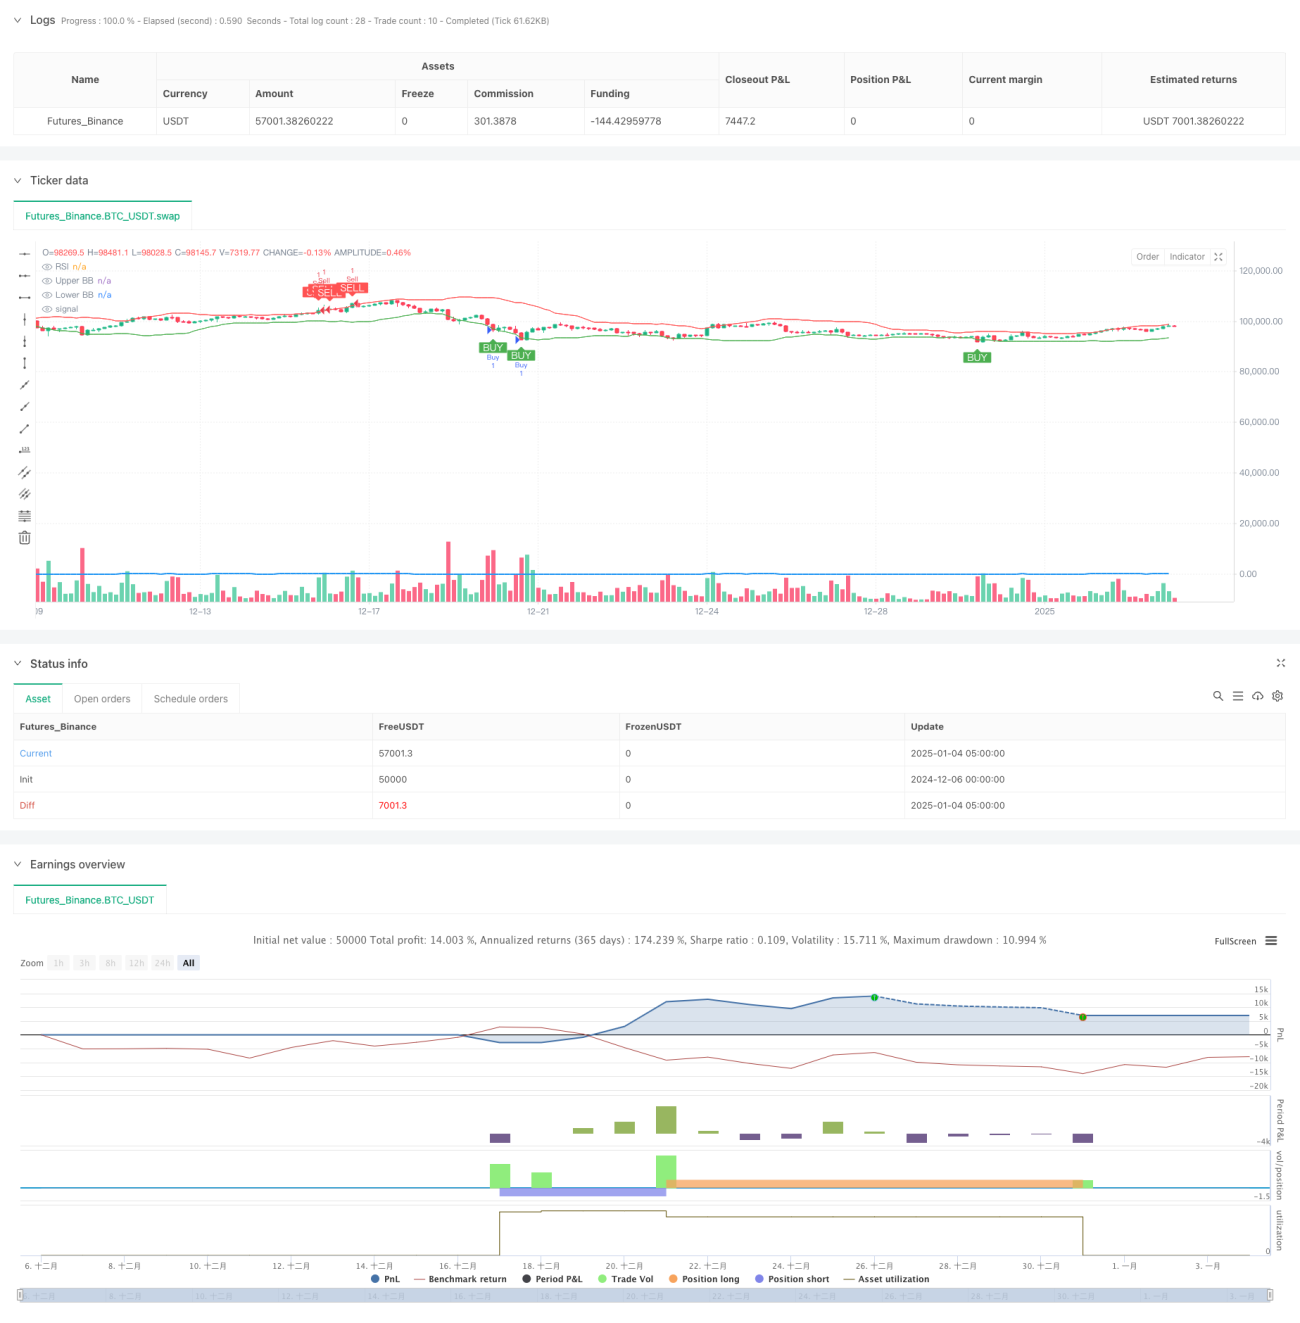
이 전략은 RSI와 볼린저 밴드의 두 가지 기술 지표를 결합하여 매수 과다와 매도 과다 영역을 식별하여 거래하는 모멘텀 반전 거래 시스템입니다. 이 전략은 1:2의 위험-수익 비율을 사용하고 위험 관리를 위해 이동형 손절매를 결합합니다. 핵심 논리는 RSI와 볼린저 밴드가 동시에 매수 과다 또는 매도 과다 신호를 보일 때 매매하고, 엄격한 위험 관리를 통해 자금을 보호하는 것입니다.
이 전략은 14주기 RSI와 20주기 볼린저 밴드를 주요 지표로 사용합니다. 매수 조건은 동시에 충족되어야 합니다: RSI가 30 미만(매도 과다)이고, 가격이 하단 볼린저 밴드에 닿거나 그 아래로 떨어집니다. 판매 조건은 동시에 충족되어야 합니다: RSI가 70(매수 과다) 이상이며, 가격이 상단 볼린저 밴드에 닿거나 초과해야 합니다. 이 시스템은 5개 K-라인의 가장 높은/가장 낮은 지점을 이동 손절매로 사용하고, 이익실현 포지션은 손절매 거리의 두 배로 엄격하게 1:2의 위험-수익 비율을 구현합니다.
이는 정확성을 높이기 위해 두 가지 기술 지표를 사용하고 엄격한 위험 관리를 적용하는 잘 구성된 역전 거래 전략입니다. 이 전략은 간단하고 직관적이지만, 성숙한 거래 시스템에 필요한 핵심 요소를 포함하고 있습니다. 제안된 최적화 방향을 통해 이 전략은 더욱 개선될 여지가 있습니다. 실제 거래에서는 먼저 충분한 백테스팅과 매개변수 최적화를 수행하는 것이 좋습니다.
/*backtest
start: 2024-12-06 00:00:00
end: 2025-01-04 08:00:00
period: 3h
basePeriod: 3h
exchanges: [{"eid":"Futures_Binance","currency":"BTC_USDT"}]
*/
//@version=5
strategy("RSI + Bollinger Bands with 1:2 Risk/Reward", overlay=true)
// Define Inputs
length_rsi = input.int(14, title="RSI Period")
oversold_level = input.int(30, title="RSI Oversold Level")
overbought_level = input.int(70, title="RSI Overbought Level")
length_bb = input.int(20, title="Bollinger Bands Period")
src = close
risk_to_reward = input.float(2.0, title="Risk-to-Reward Ratio", minval=1.0, step=0.1)
// Calculate Indicators
rsi_value = ta.rsi(src, length_rsi)
basis = ta.sma(src, length_bb)
dev = ta.stdev(src, length_bb)
upper_band = basis + 2 * dev
lower_band = basis - 2 * dev
// Define Buy and Sell Conditions
rsi_buy_condition = rsi_value < oversold_level // RSI below 30 (buy signal)
bollinger_buy_condition = close <= lower_band // Price at or near lower Bollinger Band (buy signal)
rsi_sell_condition = rsi_value > overbought_level // RSI above 70 (sell signal)
bollinger_sell_condition = close >= upper_band // Price at or near upper Bollinger Band (sell signal)
// Combine Buy and Sell Conditions
buy_condition = rsi_buy_condition and bollinger_buy_condition
sell_condition = rsi_sell_condition and bollinger_sell_condition
// Plot Buy and Sell Signals with white text and green/red boxes
plotshape(series=buy_condition, location=location.belowbar, color=color.green, style=shape.labelup, title="Buy Signal", text="BUY", textcolor=color.white, size=size.small)
plotshape(series=sell_condition, location=location.abovebar, color=color.red, style=shape.labeldown, title="Sell Signal", text="SELL", textcolor=color.white, size=size.small)
// Calculate Swing Points (for Stop Loss)
swing_low = ta.lowest(low, 5) // Last 5 bars' low
swing_high = ta.highest(high, 5) // Last 5 bars' high
// Calculate Risk (Distance from Entry to SL)
long_risk = close - swing_low
short_risk = swing_high - close
// Calculate Take Profit using 1:2 Risk-to-Reward Ratio
take_profit_long = close + 2 * long_risk
take_profit_short = close - 2 * short_risk
// Strategy Execution: Enter Buy/Sell Positions
if buy_condition
strategy.entry("Buy", strategy.long)
strategy.exit("Take Profit", "Buy", limit=take_profit_long, stop=swing_low) // Set TP and SL for Buy
if sell_condition
strategy.entry("Sell", strategy.short)
strategy.exit("Take Profit", "Sell", limit=take_profit_short, stop=swing_high) // Set TP and SL for Sell
// Plotting the Indicators for Visualization (Optional - comment out if not needed)
plot(rsi_value, color=color.blue, title="RSI", linewidth=2, display=display.none)
plot(upper_band, color=color.red, title="Upper BB", display=display.none)
plot(lower_band, color=color.green, title="Lower BB", display=display.none)