장기 추세 SMA 이동 평균 교차 양적 전략

1
Follow
1781
Followers
개요
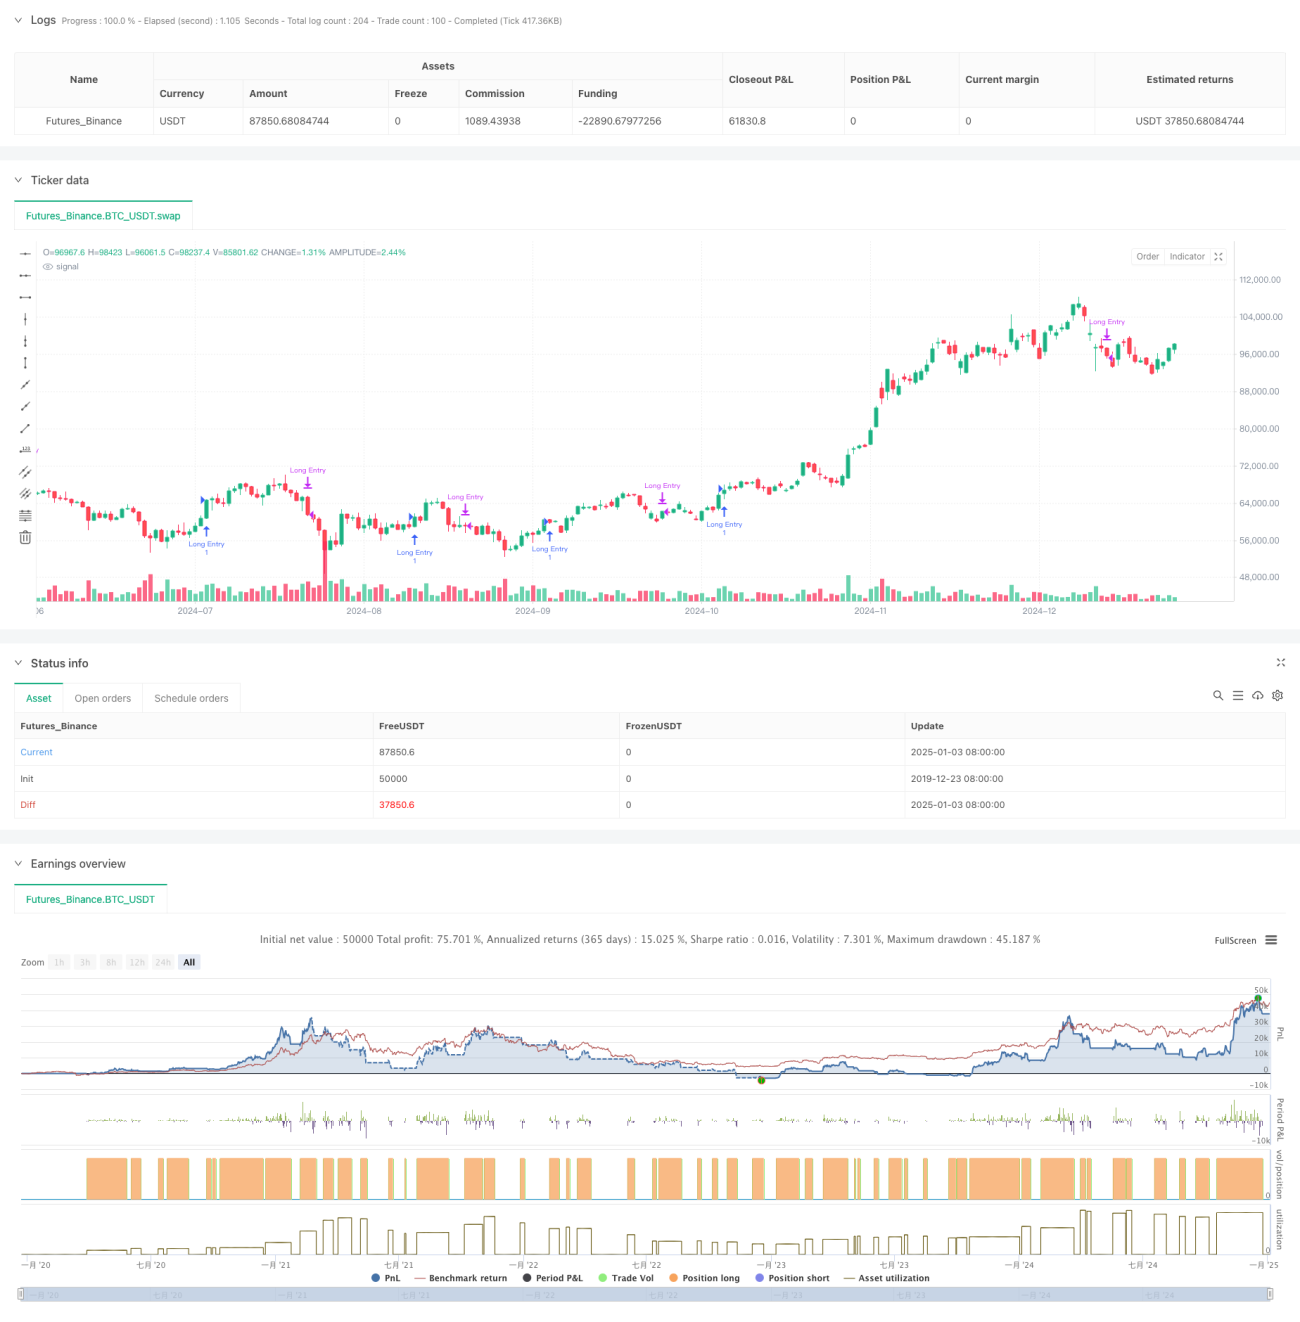
이 전략은 다기간 단순 이동 평균(SMA) 교차 신호를 기반으로 하는 양적 거래 시스템입니다. 주로 장기 상승 추세 내에서 단기 하락 기회를 식별하여 거래합니다. 이 전략은 5일, 10일, 20일, 60일, 120일의 5개 기간을 갖는 SMA 지표를 사용하여 이동 평균선의 포지션 관계와 교차 신호를 통해 시장 동향과 거래 기회를 판단합니다.
전략 원칙
전략의 핵심 논리는 다음과 같은 핵심 부분으로 구성됩니다.
- 장기 추세는 SMA20과 SMA60의 상대적 위치 관계로 판단할 수 있습니다. SMA20이 SMA60 위에 있을 때, 시장이 상승 추세에 있다는 것이 확인됩니다.
- 장기 상승 추세를 확인하는 전제 하에 단기 SMA5가 SMA20 아래에서 위로 반등할 때 매수 신호가 발생합니다. 이는 시장이 상승세에서 단기적인 하락 후 반등하고 있음을 시사합니다.
- SMA20이 SMA5를 교차하면 폐쇄 신호가 발생합니다. 이는 단기적인 상승 모멘텀이 약화되었고 조정 기간에 접어들 수 있음을 나타냅니다.
- 이 전략에는 시간 필터 기능도 포함되어 있어 백테스트의 시간 범위를 제한하고 전략의 유연성을 높일 수 있습니다.
전략적 이점
- 전략적 논리는 명확하고 간단하며, 이해하고 구현하기 쉽고, 복잡한 계산 과정이 필요하지 않습니다.
- 여러 기간의 이동 평균을 조화롭게 활용하면 시장 노이즈를 효과적으로 걸러내고 거래 신호의 신뢰성을 향상시킬 수 있습니다.
- 이 전략은 추세 시장에서 풀백 기회에 초점을 맞추는데, 이는 "추세 거래"의 핵심 개념과 일치합니다.
- EMA 대신 SMA를 사용하면 가격 변화에 대한 민감도가 낮아지고 잘못된 신호가 줄어듭니다.
- 진입 및 종료 논리가 명확하여 실행과 위험 관리가 용이합니다.
전략적 위험
- 이동평균선 시스템에는 지연이 발생하며, 이로 인해 최적이 아닌 진입 및 청산 시점이 발생할 수 있습니다.
- 변동성이 큰 시장에서는 이동평균선이 자주 교차하여 잘못된 신호가 너무 많이 발생할 수 있습니다.
- 이 전략은 변동성 필터링 메커니즘이 부족하여 변동성이 높은 기간 동안 더 큰 하락 위험에 직면할 수 있습니다.
- 거래량 등 다른 기술 지표의 협조를 고려하지 않고, 신호의 신뢰성을 개선해야 합니다.
- 고정 이동 평균 매개변수는 모든 시장 환경에 적합하지 않을 수 있습니다.
전략 최적화 방향
- 변동성 필터링을 위해 ATR 지표를 도입하고 변동성이 너무 높을 때는 거래를 피하세요.
- 거래 신호의 신뢰성을 향상시키기 위해 볼륨 확인 메커니즘을 추가했습니다.
- 다양한 시장 환경에 더 잘 적응할 수 있는 전략을 구축하기 위해 적응형 이동평균주기 메커니즘을 개발합니다.
- 강력한 추세 속에서 거래하려면 ADX 지표와 같은 추세 강도 필터를 추가하세요.
- 위험을 더 효과적으로 통제하기 위해 트레일링 스톱을 추가하는 등 손절매 메커니즘을 개선합니다.
요약하다
이 전략은 다기간 SMA 이동 평균을 사용하여 장기 상승 추세에서 풀백 기회를 포착하는 데 중점을 둔 거래 시스템을 구축합니다. 전략 설계는 간결하고 실용적이며, 이해하기 쉽고 실행하기가 쉽습니다. 변동성 필터링, 거래량 확인과 같은 최적화 조치를 도입함으로써 전략의 견고성과 신뢰성이 더욱 향상될 것으로 기대됩니다.
Source
Pine
/*backtest
start: 2019-12-23 08:00:00
end: 2025-01-04 08:00:00
period: 1d
basePeriod: 1d
exchanges: [{"eid":"Futures_Binance","currency":"BTC_USDT"}]
*/

//@version=6
strategy("Long-Term Growing Stock Strategy", overlay=true)
// Date Range
// STEP 1. Create inputs that configure the backtest's date rangeStrategy parameters
Related strategies
Comment
All comments (0)
No data
- 1