RSI 변동성 전략에 따른 다중 이동 평균 교차 추세

1
Follow
1781
Followers
개요
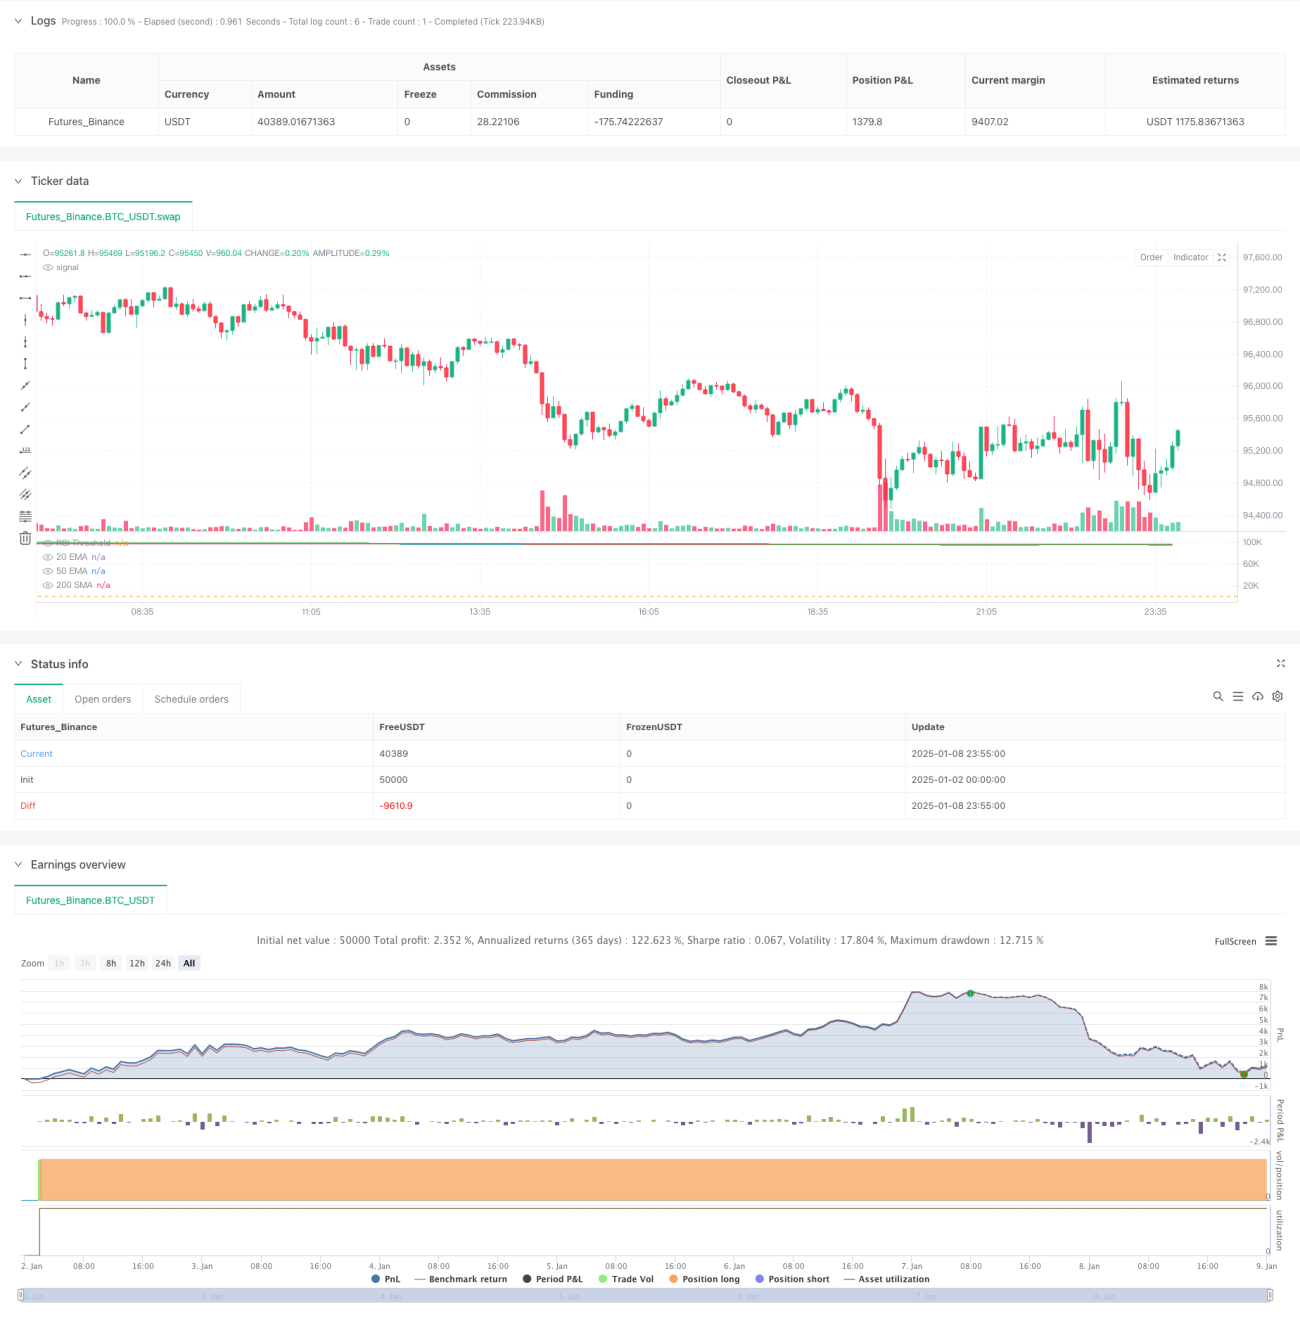
이 전략은 다중 이동 평균선 교차와 RSI 지표를 기반으로 하는 추세 추종 거래 시스템입니다. 이 전략은 EMA20, EMA50, SMA200의 3개 이동평균을 결합하고, 이동평균의 위치 관계에 따라 시장 추세를 판단하고, RSI 지표를 사용하여 거래 신호를 필터링하고, 가격이 이전 최고가를 돌파할 때 거래합니다. 이 전략은 고정된 이익 실현 및 손실 정지 조건을 설정하며 1시간 및 일간 수준에서 실행하는 데 적합합니다.
전략 원칙
전략의 핵심 논리는 다음과 같은 핵심 조건에 기초합니다.
- 추세 판단: 상승 추세를 보장하려면 EMA20은 EMA50보다 높아야 하고, SMA200은 EMA20과 EMA50보다 낮아야 합니다.
- 가격 위치: 현재 종가는 주요 지원 수준에 있는지 확인하기 위해 EMA20 또는 EMA50의 1% 이내에 있어야 합니다.
- RSI 필터링: 강력한 시장을 필터링하려면 RSI 값이 설정된 임계값(기본값 40)보다 커야 합니다.
- 진입 트리거: 가격이 이전 캔들스틱 고점을 돌파할 때, 롱 신호가 트리거됩니다.
- 위험 관리: 위험 관리를 위해 25% 이익 실현 수준과 10% 손절매 수준을 설정합니다.
전략적 이점
- 다중 확인 메커니즘: 이동 평균 시스템, RSI 지표, 가격 돌파 등 여러 차원을 통해 거래 신호를 확인하여 잘못된 신호를 줄입니다.
- 강력한 추세 추적: 여러 이동 평균 시스템을 사용하여 중기 및 장기 추세를 파악하고 거래 방향의 정확도를 높입니다.
- 완벽한 위험 관리: 고정된 이익 실현 비율과 손절매 비율을 설정하여 각 거래의 위험을 효과적으로 통제합니다.
- 우수한 적응성: 전략 매개변수는 다양한 시장 환경에 맞게 조정 가능합니다.
- 명확한 실행: 진입 및 종료 조건이 명확하고 프로그래밍 방식으로 쉽게 구현할 수 있습니다.
전략적 위험
- 변동성이 큰 시장의 위험: 가격이 좌우로 흔들리는 시장에서는 잘못된 신호가 자주 발생할 수 있습니다.
- 지연 위험: 이동평균선 시스템에는 어느 정도 지연이 발생하며, 이로 인해 최적의 진입 기회를 놓칠 수 있습니다.
- 손절매 마진 위험: 고정 손절매 비율은 모든 시장 상황에서 적합하지 않을 수 있습니다.
- 하락 위험: 추세가 반전되면 큰 하락이 발생할 수 있습니다.
전략 최적화 방향
- 동적 매개변수 최적화: 시장 변동성에 따라 이동 평균 기간과 RSI 임계값을 동적으로 조정합니다.
- 시장 환경 식별: 시장 환경 판단 메커니즘을 추가하고 다양한 시장 환경에서 다양한 매개변수 조합을 사용합니다.
- 동적 이익실현 및 손실 정지: ATR 또는 변동성에 따라 동적 이익실현 및 손실 정지 수준을 설정합니다.
- 볼륨 분석 추가: 볼륨 지표와 결합하여 신호 안정성을 개선합니다.
- 종료 메커니즘 최적화: 수익성을 개선하기 위해 더욱 유연한 종료 메커니즘을 설계합니다.
요약하다
이 전략은 완전한 구조와 명확한 논리를 갖춘 추세 추적 시스템입니다. 여러 기술 지표를 조화롭게 활용함으로써 시장 동향을 효과적으로 파악하는 동시에 완벽한 위험 관리 메커니즘을 갖추는 것이 가능합니다. 전략 최적화를 위한 여지가 많으며, 지속적인 개선을 통해 전략의 안정성과 수익성을 더욱 높일 수 있습니다. 중장기 트레이더라면 시도해 볼 만한 전략 프레임워크입니다.
Source
Pine
Strategy parameters
Related strategies
Comment
All comments (0)
No data
- 1