
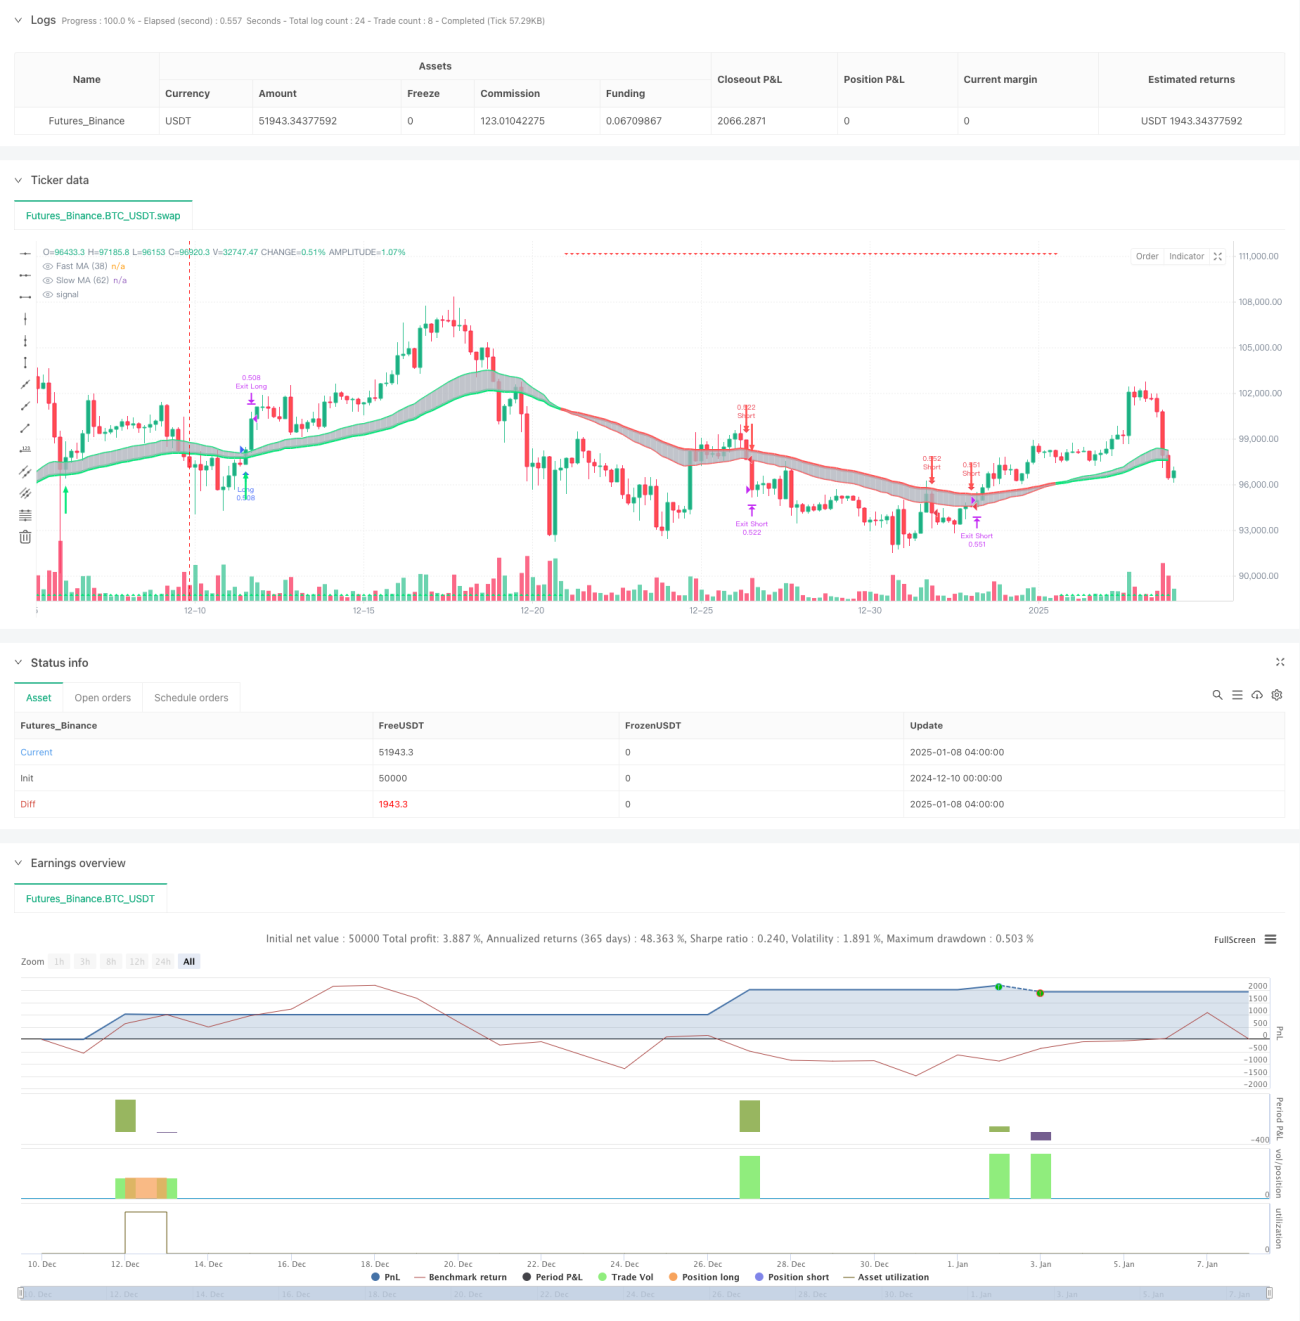
이 전략은 이중 이동 평균 시스템과 ATR 동적 손실 제한을 기반으로 하는 추세 추종 거래 시스템입니다. 38주기와 62주기 지수 이동 평균(EMA)을 사용하여 시장 동향을 파악하고, 빠른 EMA와 가격이 교차하는 시점을 통해 진입 신호를 결정하고, 동적 손절매 관리를 위해 ATR 지표와 결합합니다. 이 전략은 다양한 위험 선호도를 지닌 거래자에게 맞춰 공격적인 거래 모드와 보수적인 거래 모드를 모두 제공합니다.
전략의 핵심 논리는 다음과 같은 핵심 요소에 기초합니다.
이 전략은 고전적인 이중 이동 평균 시스템과 최신의 동적 손절매 기술을 결합하여 완전한 추세 추종 거래 시스템을 구축합니다. 이 전략의 장점은 완벽한 위험 관리와 강력한 적응성이지만, 거래자는 여전히 특정 시장 환경에 따라 매개변수를 최적화하고 위험을 관리해야 합니다. 제안된 최적화 방향을 통해 전략의 안정성과 수익성이 더욱 향상될 것으로 기대됩니다.
/*backtest
start: 2024-12-10 00:00:00
end: 2025-01-08 08:00:00
period: 4h
basePeriod: 4h
exchanges: [{"eid":"Futures_Binance","currency":"BTC_USDT"}]
*/
// This Pine Script™ code is subject to the terms of the Mozilla Public License 2.0 at https://mozilla.org/MPL/2.0/
// © aalapsharma
//@version=5
strategy(title="CM_SlingShotSystem - Strategy", shorttitle="SlingShotSys_Enhanced_v5", overlay=true, initial_capital=100000, default_qty_type=strategy.percent_of_equity, default_qty_value=100, pyramiding=1)
// Inputs
sae = input.bool(true, "Show Aggressive Entry Bars? (Highlight only)")
sce = input.bool(true, "Show Conservative Entry Bars? (Highlight only)")
st = input.bool(true, "Show Trend Arrows (Top/Bottom)?")
def = input.bool(false, "(Unused) Only Choose 1 - Either Conservative Entry Arrows or 'B'-'S' Letters")
pa = input.bool(true, "Show Conservative Entry Arrows?")
sl = input.bool(false, "Show 'B'-'S' Letters?")
useStopLoss = input.bool(true, "Use Stop-Loss?")
stopLossPerc = input.float(5.0, "Stop-Loss (%)", step=0.1)
useTakeProfit = input.bool(true, "Use Take-Profit?")
takeProfitPerc = input.float(20.0, "Take-Profit (%)", step=0.1)
useTrailingStop = input.bool(false, "Use ATR Trailing Stop?")
atrLength = input.int(14, "ATR Length", minval=1)
atrMult = input.float(2.0, "ATR Multiple for Trailing Stop", step=0.1)
// Calculations
emaSlow = ta.ema(close, 62)
emaFast = ta.ema(close, 38)
upTrend = emaFast >= emaSlow
downTrend = emaFast < emaSlow
pullbackUpT() => emaFast > emaSlow and close < emaFast
pullbackDnT() => emaFast < emaSlow and close > emaFast
entryUpT() => emaFast > emaSlow and close[1] < emaFast and close > emaFast
entryDnT() => emaFast < emaSlow and close[1] > emaFast and close < emaFast
entryUpTrend = entryUpT() ? 1 : 0
entryDnTrend = entryDnT() ? 1 : 0
atrValue = ta.atr(atrLength)
// Trailing Stop Logic (Improved)
var float trailStopLong = na
var float trailStopShort = na
if (strategy.position_size > 0)
trailStopLong := math.max(close - (atrValue * atrMult), nz(trailStopLong[1], close))
trailStopLong := strategy.position_avg_price > trailStopLong ? strategy.position_avg_price : trailStopLong
else
trailStopLong := na
if (strategy.position_size < 0)
trailStopShort := math.min(close + (atrValue * atrMult), nz(trailStopShort[1], close))
trailStopShort := strategy.position_avg_price < trailStopShort ? strategy.position_avg_price : trailStopShort
else
trailStopShort := na
// Plotting
col = emaFast > emaSlow ? color.lime : emaFast < emaSlow ? color.red : color.yellow
p1 = plot(emaSlow, "Slow MA (62)", linewidth=4, color=col)
p2 = plot(emaFast, "Fast MA (38)", linewidth=2, color=col)
fill(p1, p2, color=color.silver, transp=50)
barcolor((sae and pullbackUpT()) ? color.yellow : (sae and pullbackDnT()) ? color.yellow : na)
barcolor((sce and entryUpT()) ? color.aqua : (sce and entryDnT()) ? color.aqua : na)
plotshape(st and upTrend, title="Trend UP", style=shape.triangleup, location=location.bottom, color=color.lime)
plotshape(st and downTrend, title="Trend DOWN", style=shape.triangledown, location=location.top, color=color.red)
plotarrow((pa and entryUpTrend == 1) ? 1 : na, title="Up Entry Arrow", colorup=color.lime, maxheight=30, minheight=30)
plotarrow((pa and entryDnTrend == 1) ? -1 : na, title="Down Entry Arrow", colordown=color.red, maxheight=30, minheight=30)
plotchar(sl and entryUpTrend ? (low - ta.tr) : na, title="Buy Entry (Letter)", char='B', location=location.absolute, color=color.lime)
plotchar(sl and entryDnTrend ? (high + ta.tr) : na, title="Short Entry (Letter)", char='S', location=location.absolute, color=color.red)
plot(useTrailingStop and strategy.position_size > 0 ? trailStopLong : na, "Trailing Stop Long", color=color.green, style=plot.style_linebr)
plot(useTrailingStop and strategy.position_size < 0 ? trailStopShort : na, "Trailing Stop Short", color=color.red, style=plot.style_linebr)
// Function to calculate stop and limit prices
f_calcStops(_entryPrice, _isLong) =>
_stopLoss = _isLong ? _entryPrice * (1.0 - stopLossPerc / 100.0) : _entryPrice * (1.0 + stopLossPerc / 100.0)
_takeProfit = _isLong ? _entryPrice * (1.0 + takeProfitPerc / 100.0) : _entryPrice * (1.0 - takeProfitPerc / 100.0)
[_stopLoss, _takeProfit]
// Entry and Exit Logic (Simplified using strategy.close)
if (entryUpT() and strategy.position_size == 0)
strategy.entry("Long", strategy.long)
if (entryDnT() and strategy.position_size == 0)
strategy.entry("Short", strategy.short)
// Exit conditions based on Stop-loss and Take-profit
[slPrice, tpPrice] = f_calcStops(strategy.position_avg_price, strategy.position_size > 0)
if (strategy.position_size > 0)
strategy.exit("Exit Long", "Long", stop=slPrice, limit=tpPrice, trail_price = trailStopLong, trail_offset = atrValue * atrMult)
if (strategy.position_size < 0)
strategy.exit("Exit Short", "Short", stop=slPrice, limit=tpPrice, trail_price = trailStopShort, trail_offset = atrValue * atrMult)
// Close opposite position on new entry signal
if (entryUpT() and strategy.position_size < 0)
strategy.close("Short", comment="Close Short on Long Signal")
if (entryDnT() and strategy.position_size > 0)
strategy.close("Long", comment="Close Long on Short Signal")