고주파 가격 및 거래량 추세 추적 및 거래량 분석 적응 전략

1
Follow
1781
Followers
개요
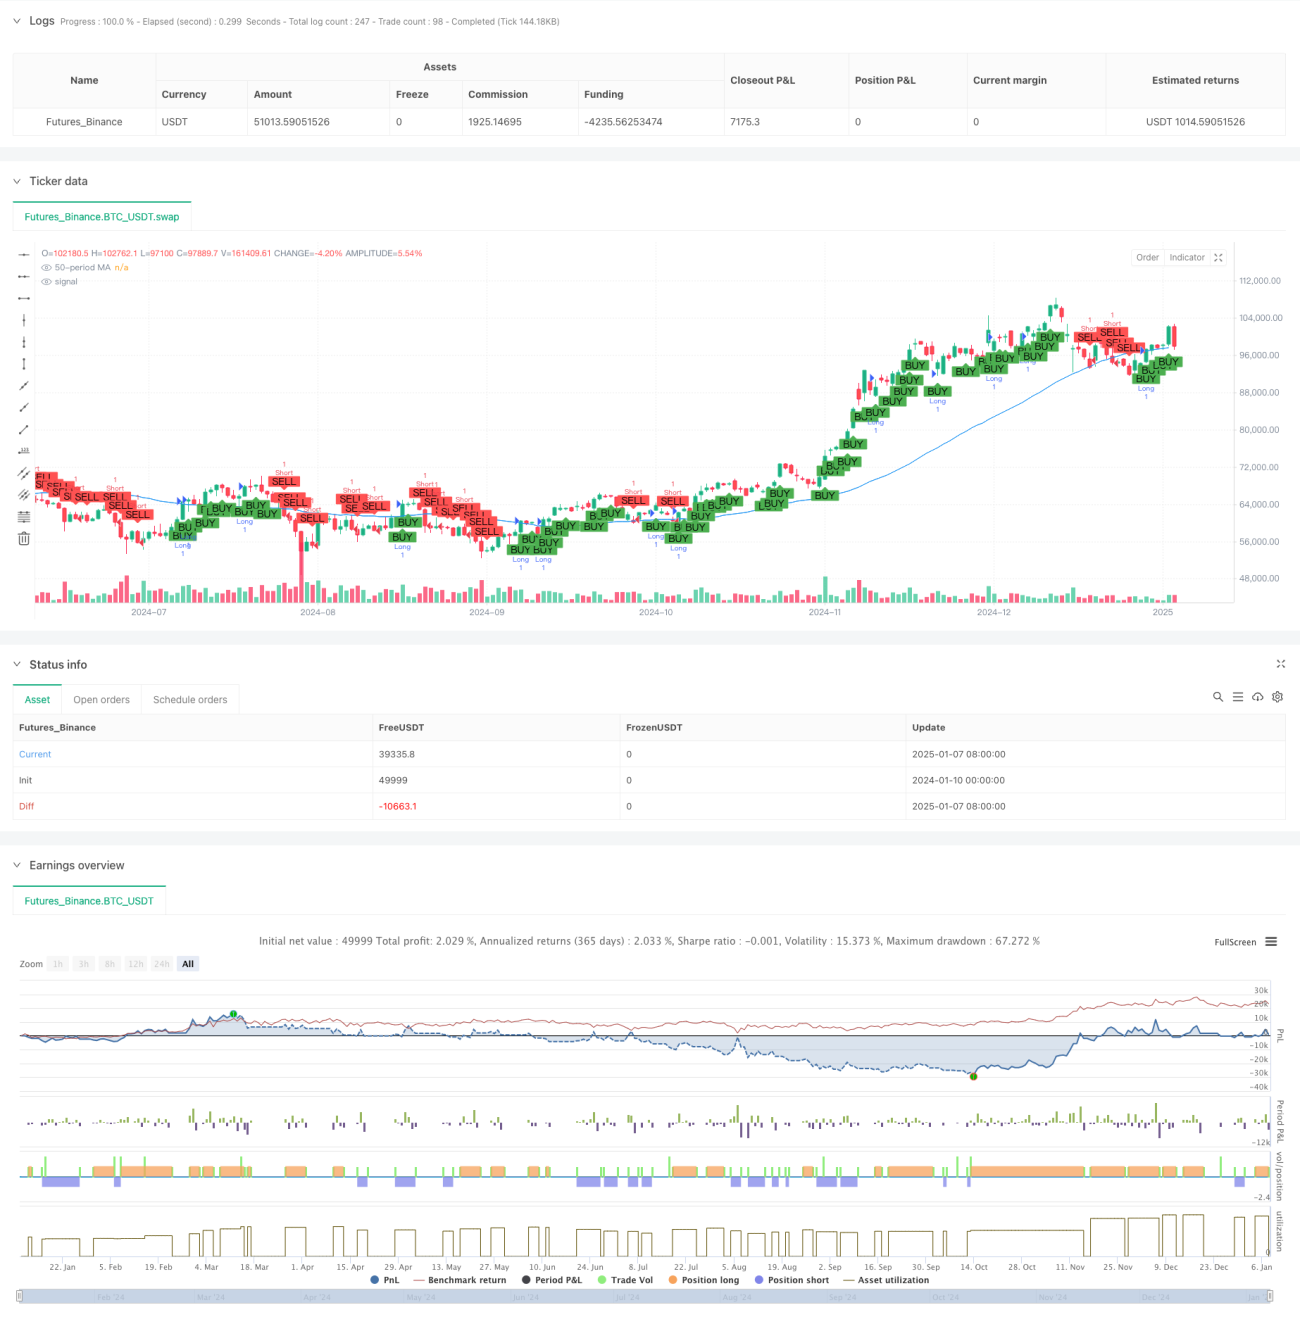
이 전략은 이동 평균선 추세 추종과 거래량 분석 방법을 결합한 5분 단위의 자동 거래 시스템입니다. 이 전략은 시장 동향을 파악하기 위해 50기간 단순 이동 평균(SMA)을 사용하고 거래 신호의 유효성을 확인하기 위해 거래량 분석을 도입합니다. 이 시스템은 완전 자동화된 거래를 실현하기 위해 고정된 손절매 및 수익 목표를 사용합니다.
전략 원칙
전략의 핵심 논리에는 다음과 같은 핵심 구성 요소가 포함됩니다.
- 추세 식별: 50주기 SMA를 사용하여 시장 방향을 결정합니다. 종가가 이동 평균보다 높으면 상승 추세로 간주되고, 그렇지 않으면 하락 추세로 간주됩니다. 동시에 지난 30분 동안의 가격 추세(6개 K-라인)를 결합하여 추세를 확인합니다.
- 거래량 분석: 가격 변동에 따른 매수·매도 거래량을 산출하고, 각 K-라인 내 거래량을 종가 포지션에 따라 매수 거래량과 매도 거래량으로 배분합니다.
- 거래 신호 생성: 상승 추세에서는 매수량이 매도량보다 클 때 롱 신호가 생성되고, 하락 추세에서는 매도량이 매수량보다 클 때 숏 신호가 생성됩니다.
- 위험 관리: 3%의 손절매와 29%의 수익 목표를 사용하여 각 거래의 위험-보상 비율을 관리하세요.
전략적 이점
- 다차원적 추세 확인: 이동 평균선과 단기 가격 추세를 결합하여 추세를 이중으로 확인함으로써 추세 판단의 정확도가 향상됩니다.
- 거래량 검증: 저거래량 환경에서 잘못된 돌파가 발생하는 것을 방지하기 위해 거래 신호 필터로 거래량 분석을 도입합니다.
- 완벽한 위험 관리: 단일 거래의 위험을 효과적으로 통제하기 위해 명확한 손절매 및 수익 목표를 설정합니다.
- 강력한 적응성: 이 전략은 시장 상황에 따라 거래 방향을 자동으로 조정하고 다양한 시장 환경에 적응할 수 있습니다.
전략적 위험
- 변동성이 큰 시장의 위험: 횡보장이고 변동성이 큰 시장에서는 잘못된 돌파 신호가 자주 발생할 수 있으며, 이로 인해 지속적인 손절매가 발생할 수 있습니다.
- 슬리피지 위험: 고빈도 거래에서는 큰 슬리피지가 발생할 수 있으며, 이는 실제 실행 효과에 영향을 미칠 수 있습니다.
- 매개변수 민감도: 전략 효과는 이동 평균 기간, 거래량 계산 기간과 같은 매개변수에 민감합니다.
- 시장 환경에 따른 의존성: 이 전략은 명확한 추세가 있는 시장에서는 좋은 성과를 거두지만, 추세가 전환되는 기간에는 큰 하락을 경험할 수 있습니다.
전략 최적화 방향
- 동적 매개변수 최적화: 적응형 매개변수 메커니즘을 도입하여 시장 변동성에 따라 이동 평균 기간과 거래량 계산 기간을 동적으로 조정할 수 있습니다.
- 시장 환경 필터링 강화: 변동성 지표나 추세 강도 지표를 추가하여 부적합한 시장 상황에서는 거래를 자동으로 중단합니다.
- 손절매 메커니즘 개선: 추적 손절매나 ATR 기반 손절매와 같은 동적 손절매를 사용하면 위험 관리의 유연성을 높일 수 있습니다.
- 신호 생성 논리를 최적화하세요. 신호 신뢰성을 개선하기 위해 교차 검증에 더 많은 기술적 지표를 추가하는 것을 고려하세요.
요약하다
이 전략은 추세 추적과 거래량 분석을 결합하여 완전한 고빈도 거래 시스템을 구축합니다. 이 전략의 주요 장점은 다차원적인 신호 확인 메커니즘과 완벽한 위험 관리 시스템에 있습니다. 몇 가지 본질적인 위험은 있지만, 제안된 최적화 방향을 통해 전략의 안정성과 적응성을 더욱 개선할 수 있습니다. 이 전략은 특히 추세가 명확한 시장 환경에서 운영하는 데 적합하며, 합리적인 매개변수 최적화와 위험 관리를 통해 안정적인 거래 결과를 얻을 수 있을 것으로 기대됩니다.
Source
Pine
/*backtest
start: 2024-01-10 00:00:00
end: 2025-01-08 08:00:00
period: 1d
basePeriod: 1d
exchanges: [{"eid":"Futures_Binance","currency":"BTC_USDT","balance":49999}]
*/

// This Pine Script™ code is subject to the terms of the Mozilla Public License 2.0 at https://mozilla.org/MPL/2.0/
// © Jerryorange

//@version=6Strategy parameters
Related strategies
Comment
All comments (0)
No data
- 1