동적 신경망 RSI 추세 추종 거래 전략

1
Follow
1781
Followers
개요
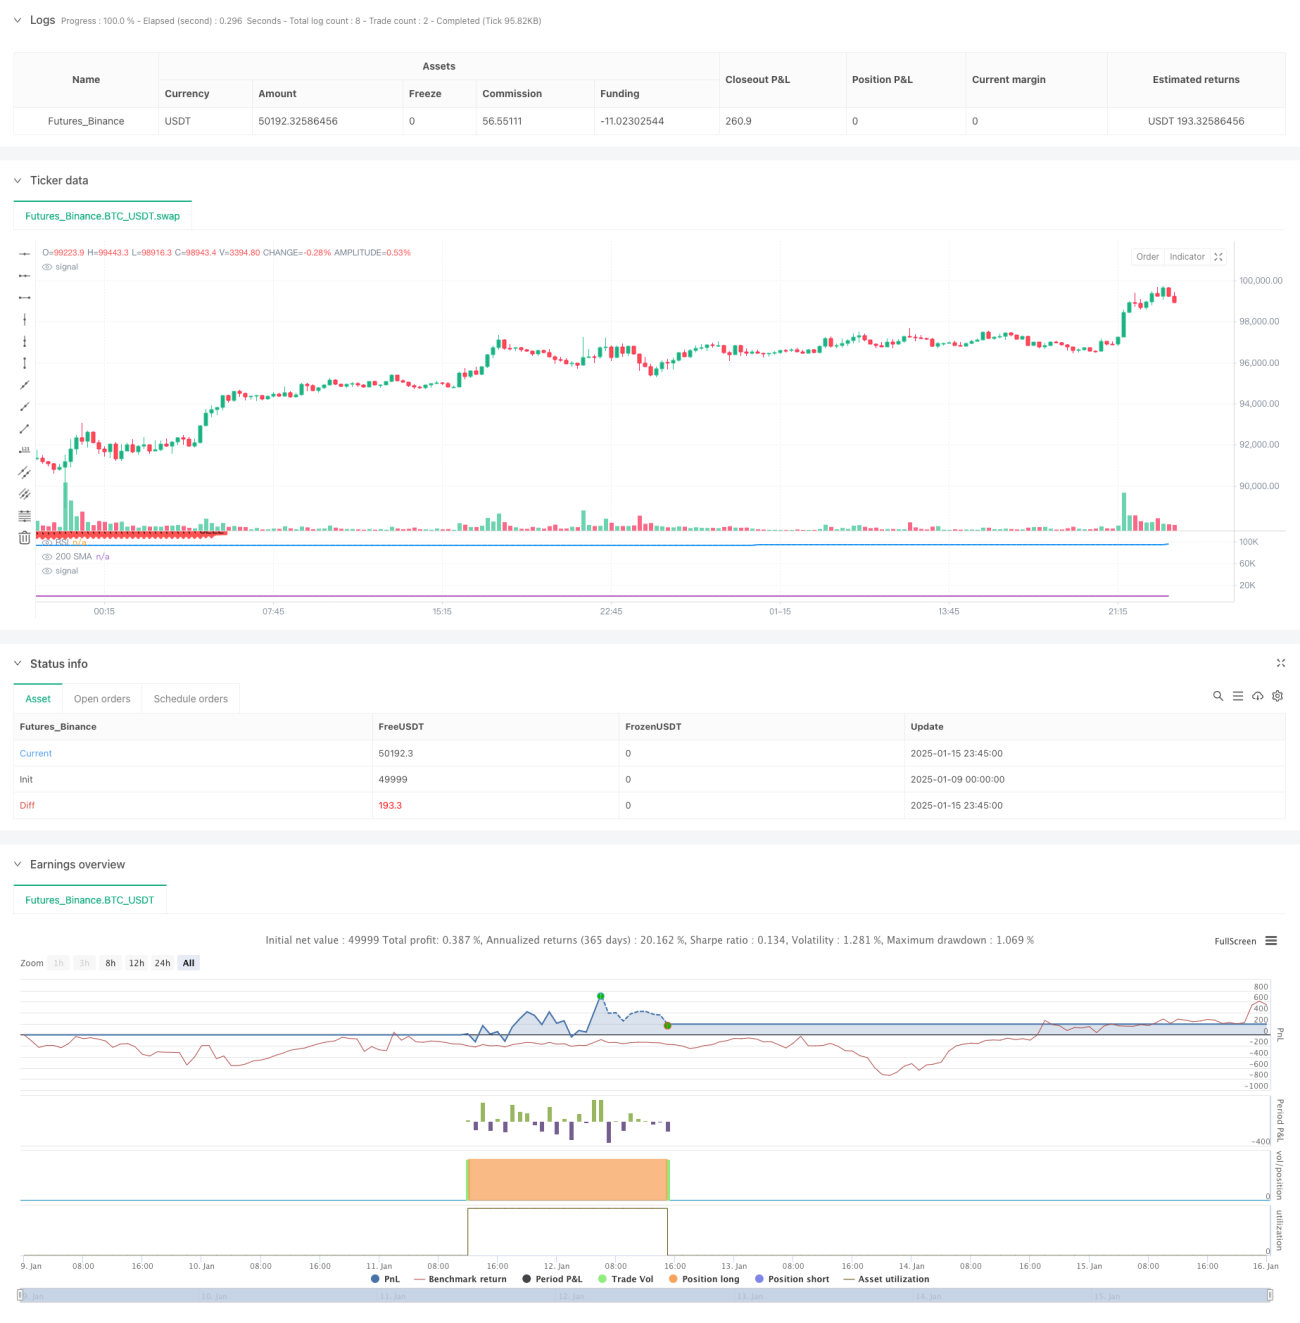
이 전략은 이동 평균선, RSI 지표, 추적 손절매를 기반으로 하는 양적 거래 시스템입니다. 기술 분석에서 추세 추적과 모멘텀 지표를 결합하여 엄격한 진입 및 청산 조건을 설정함으로써 위험 관리형 거래를 달성합니다. 이 전략의 핵심 논리는 상승 추세에서 시장에 진입할 과매도 기회를 찾고, 추적 손절매를 사용하여 수익을 보호하는 것입니다.
전략 원칙
이 전략은 200일 간단 이동 평균(SMA)을 추세 판단의 기준으로 사용하고 이를 상대 강도 지수(RSI)와 결합하여 거래 신호를 생성합니다. 구체적으로:
- 200일 이동 평균을 사용하여 일반적인 추세를 파악하고 가격이 이동 평균보다 높을 때만 롱 포지션을 고려하십시오.
- RSI가 사전 설정된 임계값(기본값 40) 아래로 떨어지면 매도 과열 신호로 간주됩니다.
- 위의 두 조건이 모두 충족되고 마지막 포지션이 마감된 이후 대기 기간(기본 10일)이 경과하면 장기 신호가 트리거됩니다.
- 포지션 유지 중 트레일링 스톱 로스(기본값 5%)를 통해 동적으로 수익을 보호합니다.
- 가격이 추적 손절가 이하로 떨어지거나 200일 이동평균 이하로 떨어지면 포지션을 종료합니다.
전략적 이점
- 추세와 모멘텀 이중 필터링을 결합하여 거래 정확도를 향상합니다.
- 추적 손절매 메커니즘을 사용하면 효과적으로 수익을 확보할 수 있습니다.
- 빈번한 거래를 피하기 위해 거래 간격을 설정하세요
- 매개변수는 다양한 시장 환경에 적응하도록 매우 조정 가능합니다.
- 거래 논리가 명확하고 이해하기 쉬우며 실행하기 쉽습니다.
- 간단한 계산과 높은 효율성
전략적 위험
- 이동 평균 지연으로 인해 진입 및 종료 신호가 지연될 수 있습니다.
- RSI 지표는 변동성이 큰 시장에서 잘못된 신호를 생성할 수 있습니다.
- 고정 비율 추적 정지는 모든 시장 상황에 적합하지 않을 수 있습니다.
- 매개변수 최적화로 인해 과적합이 발생할 수 있습니다.
- 변동성이 큰 시장에서는 큰 하락을 겪을 수 있습니다.
전략 최적화 방향
- 변동성 적응형 트레일링 스톱 비율 소개
- 보조 확인으로 볼륨 표시기 추가
- 민감도를 개선하려면 단순 이동 평균 대신 지수 이동 평균을 사용하세요.
- 거래 기회를 최적화하기 위해 시장 감정 지표를 추가하세요
- 동적 매개변수 최적화 메커니즘 개발
- 다중 기간 전략 확인 메커니즘 추가
요약하다
이는 완전한 구조와 명확한 논리를 갖춘 양적 거래 전략입니다. 안정적인 수익을 추구하면서 리스크도 통제하기 위해 여러 가지 기술 지표를 결합합니다. 최적화의 여지가 있기는 하지만 기본 프레임워크는 실용성과 확장성이 좋습니다. 이 전략은 중장기 투자자에게 적합하며 다양한 시장 환경에 잘 적응합니다.
Source
Pine
Strategy parameters
Related strategies
Comment
All comments (0)
No data
- 1