개요
이 전략은 이동 평균선과 아웃사이드 바 패턴을 결합한 추세 추종 시스템입니다. 이 지표는 5주기와 9주기 지수 이동 평균(EMA)을 주요 추세 지표로 사용하며, 외부 막대 패턴을 신호 확인으로 결합합니다. 이 전략에는 아웃사이드 바 높이를 기반으로 한 동적 손절매 및 이익 실현 설정과 손절매가 발동된 후의 포지션 반전 메커니즘이 포함됩니다.
전략 원칙
전략의 핵심 논리는 다음과 같은 핵심 요소에 기초합니다.
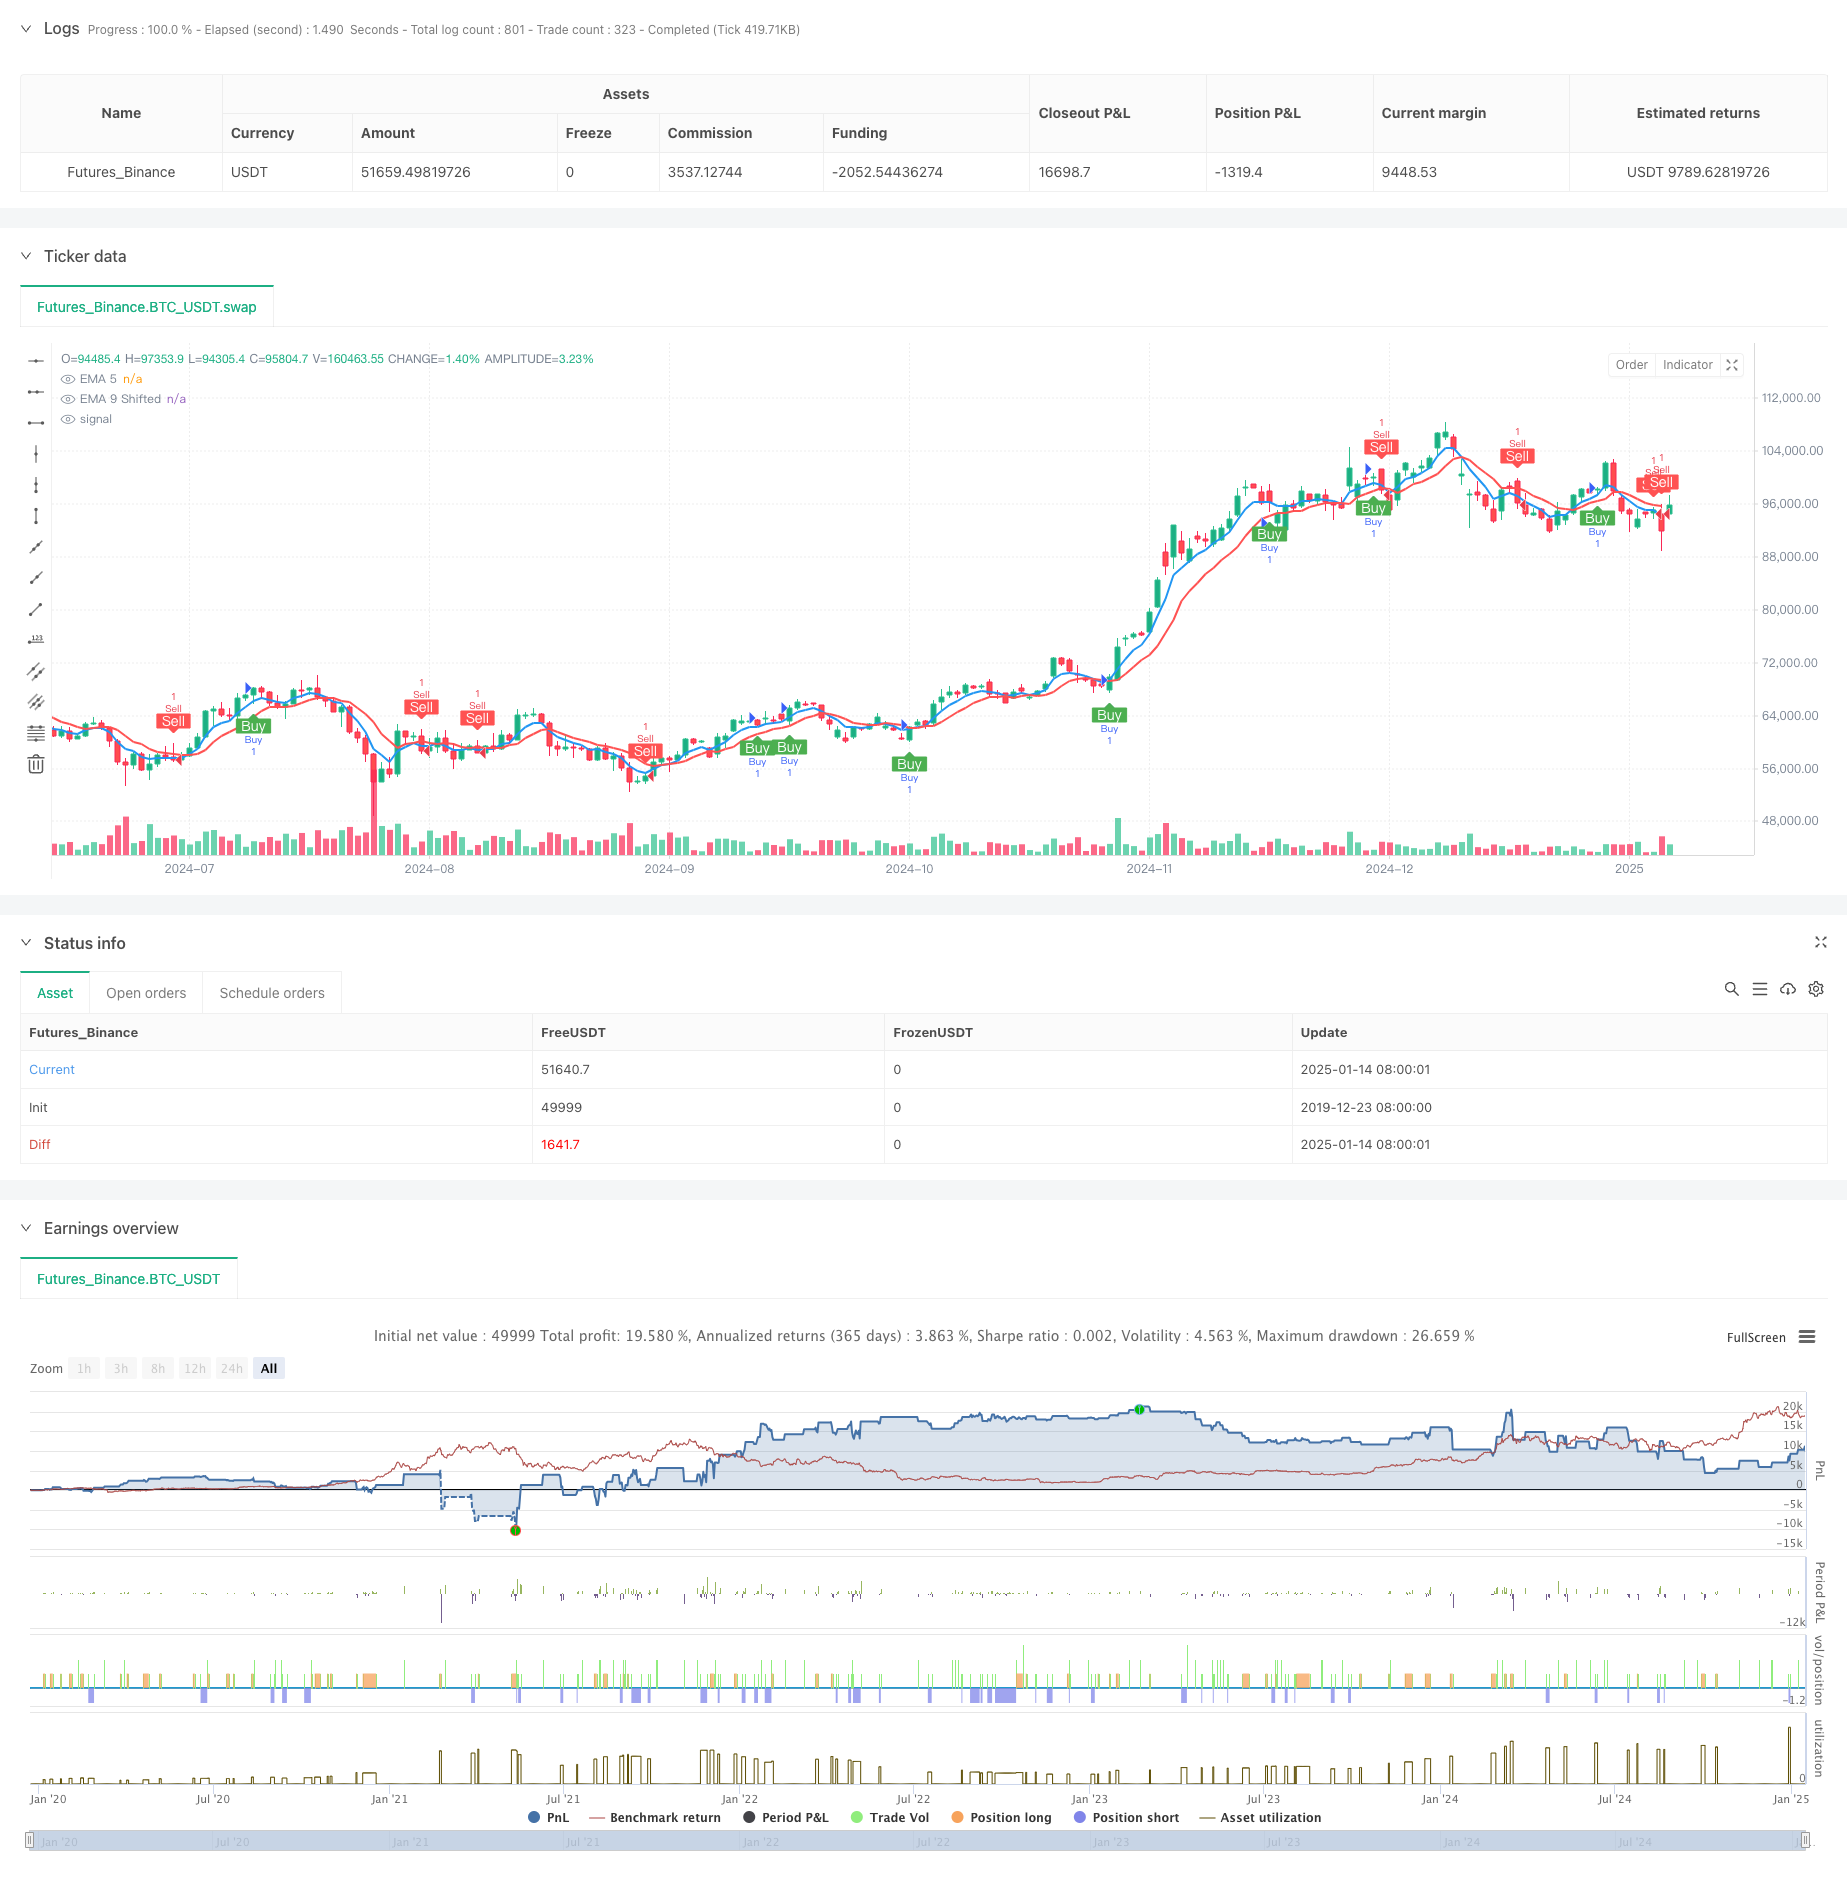
- 5주기와 9주기 EMA의 교차를 사용하여 기본 추세 방향을 결정합니다.
- Outside Bar 패턴을 통해 시장 변동성을 확인하세요(현재 K-라인의 최고가는 이전 K-라인의 최고가보다 높고, 최저가는 이전 K-라인의 최저가보다 낮음)
- EMA 교차 신호와 Outside Bar 패턴이 동시에 나타나면 거래를 시작하세요.
- 아웃사이드 바의 높이를 사용하여 손절매 및 이익 실현 수준을 동적으로 설정합니다. 이익 실현은 아웃사이드 바 높이의 50%로 설정되고 손절매는 100%로 설정됩니다.
- 손절매가 발동되면 추세 반전 가능성을 포착하기 위해 자동으로 반전 포지션이 설정됩니다.
전략적 이점
- 이중 확인 메커니즘은 거래의 정확성을 높이고 단일 지표로 인해 발생할 수 있는 잘못된 신호를 방지합니다.
- 동적 손절매 및 이익 실현 설정은 시장 변동성에 더 잘 적응하고 다양한 시장 환경에서 합리적인 위험 관리를 유지합니다.
- 포지션 반전 메커니즘은 시장 동향의 변화에 빠르게 적응하고 자본 활용 효율성을 개선할 수 있습니다.
- 이 전략은 진입 및 청산 규칙이 명확하고 실행 및 백테스트가 쉽습니다.
전략적 위험
- 변동성이 낮은 시장에서는 외부 막대 패턴이 덜 자주 나타날 수 있으며 이는 거래 빈도에 영향을 미칩니다.
- 빠르게 움직이는 시장에서 손절매 포지션이 너무 넓어 단일 거래의 위험이 커질 수 있습니다.
- 포지션 반전 메커니즘은 변동성이 큰 시장에서 지속적인 손절매로 이어질 수 있습니다.
- 고정 EMA 매개변수는 다양한 시장 환경에서 일관되게 작동하지 않을 수 있습니다.
전략 최적화 방향
- 변동성 지수를 도입하면 손절매 비율과 이익실현 비율을 동적으로 조정하여 위험 관리를 보다 유연하게 할 수 있습니다.
- 약한 추세 환경에서 거래를 피하기 위해 추세 강도 필터를 추가하는 것을 고려하세요.
- 포지션 반전을 위한 트리거 조건을 최적화하고 시장 변동성 지표를 결합하여 반전을 실행할지 여부를 결정합니다.
- 시스템 적응성을 개선하기 위해 다양한 기간 동안 EMA 매개변수 최적화 계획을 연구합니다.
요약하다
이는 고전적인 기술적 분석 이론과 현대적인 양적 거래 개념을 결합한 전략 시스템입니다. 이동 평균선과 아웃사이드 바를 조화롭게 사용하면 추세 추적의 적시성이 보장될 뿐만 아니라 신호의 신뢰성도 향상됩니다. 동적 손절매, 이익실현 및 포지션 반전 메커니즘의 설계는 위험 관리에 대한 강조를 반영하며 전략을 실용적으로 만들어줍니다. 아직 최적화의 여지가 있기는 하지만, 전반적인 프레임워크에는 실시간 작업을 위한 기본 조건이 이미 갖춰져 있습니다.
전략 소스 코드
/*backtest
start: 2019-12-23 08:00:00
end: 2025-01-15 08:00:00
period: 1d
basePeriod: 1d
exchanges: [{"eid":"Futures_Binance","currency":"BTC_USDT","balance":49999}]
*/

//@version=5
strategy(title="Outside Bar EMA Crossover Strategy with EMA Shift", shorttitle="Outside Bar EMA Cross", overlay=true)

// Input for EMA lengths
lenEMA1 = input.int(5, title="EMA 5 Length")
lenEMA2 = input.int(9, title="EMA 9 Length")

// Input for EMA 9 shift
emaShift = input.int(1, title="EMA 9 Shift", minval=0)

// Calculate EMAs
ema1 = ta.ema(close, lenEMA1)
ema2 = ta.ema(close, lenEMA2)

// Apply shift to EMA 9
ema2Shifted = na(ema2[emaShift]) ? na : ema2[emaShift]  // Dịch chuyển EMA 9 bằng cách sử dụng offset

// Plot EMAs
plot(ema1, title="EMA 5", color=color.blue, linewidth=2)
plot(ema2Shifted, title="EMA 9 Shifted", color=color.red, linewidth=2)

// Outside Bar condition
outsideBar() => high > high[1] and low < low[1]

// Cross above EMA 5 and EMA 9 (shifted)
crossAboveEMA = close > ema1 and close > ema2Shifted

// Cross below EMA 5 and EMA 9 (shifted)
crossBelowEMA = close < ema1 and close < ema2Shifted

// Outside Bar cross above EMA 5 and EMA 9 (shifted)
outsideBarCrossAbove = outsideBar() and crossAboveEMA

// Outside Bar cross below EMA 5 and EMA 9 (shifted)
outsideBarCrossBelow = outsideBar() and crossBelowEMA

// Plot shapes for visual signals
plotshape(series=outsideBarCrossAbove, title="Outside Bar Cross Above", location=location.belowbar, color=color.green, style=shape.labelup, text="Buy", textcolor=color.white)
plotshape(series=outsideBarCrossBelow, title="Outside Bar Cross Below", location=location.abovebar, color=color.red, style=shape.labeldown, text="Sell", textcolor=color.white)

// Calculate Outside Bar height
outsideBarHeight = high - low  // Chiều cao của nến Outside Bar

// Calculate TP and SL levels
tpRatio = 0.5  // TP = 50% chiều cao nến Outside Bar
slRatio = 1.0  // SL = 100% chiều cao nến Outside Bar

tpLevelLong = close + outsideBarHeight * tpRatio  // TP cho lệnh mua
slLevelLong = close - outsideBarHeight * slRatio  // SL cho lệnh mua

tpLevelShort = close - outsideBarHeight * tpRatio  // TP cho lệnh bán
slLevelShort = close + outsideBarHeight * slRatio  // SL cho lệnh bán

// Strategy logic
if (outsideBarCrossAbove)
    strategy.entry("Buy", strategy.long)
    strategy.exit("Take Profit/Stop Loss", "Buy", stop=slLevelLong, limit=tpLevelLong)  // Thêm TP và SL

if (outsideBarCrossBelow)
    strategy.entry("Sell", strategy.short)
    strategy.exit("Take Profit/Stop Loss", "Sell", stop=slLevelShort, limit=tpLevelShort)  // Thêm TP và SL

// Logic: Nếu lệnh Buy bị Stop Loss => Vào lệnh Sell
if (strategy.position_size > 0 and close <= slLevelLong)
    strategy.close("Buy")
    strategy.entry("Sell After Buy SL", strategy.short)

// Logic: Nếu lệnh Sell bị Stop Loss => Vào lệnh Buy
if (strategy.position_size < 0 and close >= slLevelShort)
    strategy.close("Sell")
    strategy.entry("Buy After Sell SL", strategy.long)

// Cảnh báo khi label Buy xuất hiện
alertcondition(condition=outsideBarCrossAbove, title="Label Buy Xuất Hiện", message="Label Buy xuất hiện tại giá: {{close}}")

// Cảnh báo khi label Sell xuất hiện
alertcondition(condition=outsideBarCrossBelow, title="Label Sell Xuất Hiện", message="Label Sell xuất hiện tại giá: {{close}}")