다중 채널 동적 지원 및 저항 Kenny 채널 전략

KC EMA ATR SMA WMA PP SR
생성 날짜: 2025-01-17 15:17:59 마지막으로 수정됨: 2025-01-17 15:17:59
복사: 0 클릭수: 337
avatar of ChaoZhang ChaoZhang
1
집중하다
1617
수행원

다중 채널 동적 지원 및 저항 Kenny 채널 전략

개요

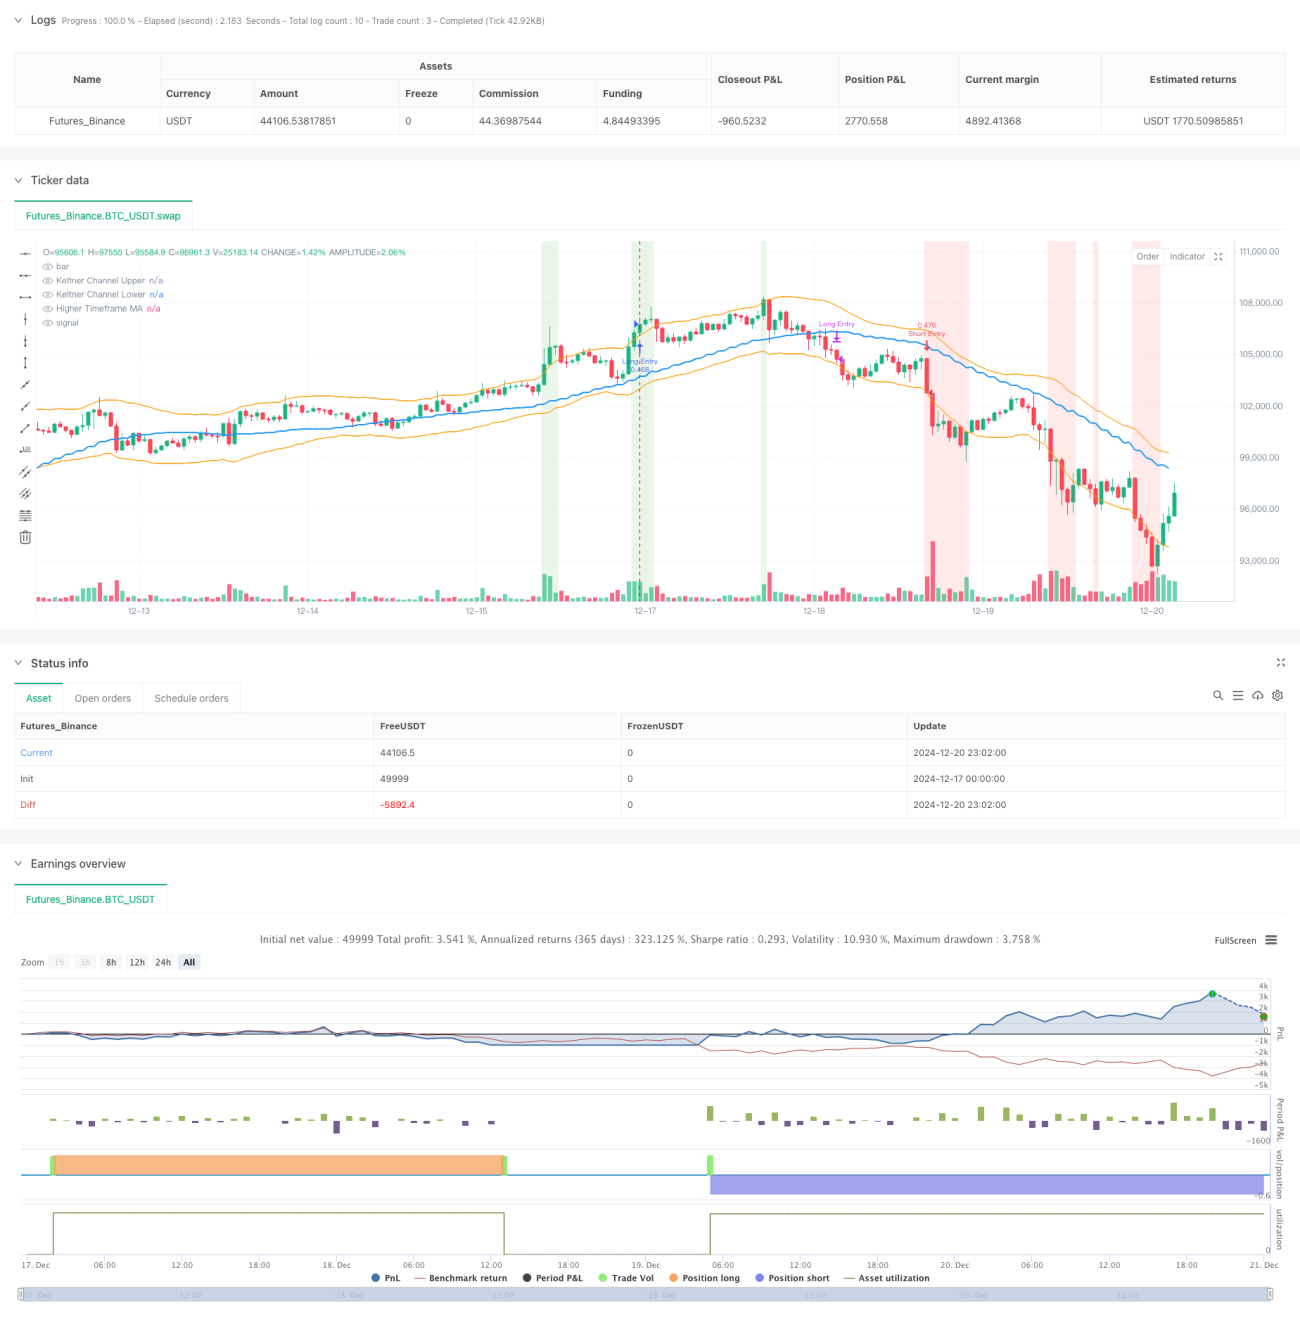
이 전략은 켈트너 채널과 역동적인 지지 및 저항 수준을 기반으로 한 복합 거래 시스템입니다. 여러 기간을 분석하고 이동 평균선과 변동성 지표를 결합하여 완전한 거래 의사 결정 프레임워크를 형성합니다. 전략의 핵심은 시장 동향과 변동성을 고려하면서 가격이 주요 기술 수준을 돌파하는 순간을 파악하여 확률이 높은 거래 기회를 포착하는 것입니다.

전략 원칙

이 전략은 분석을 위해 다층 기술 지표 시스템을 사용합니다.

  1. 21주기 케니 채널을 주요 추세 결정 도구로 사용하고, 채널 폭은 ATR 값에 의해 결정됩니다.
  2. 왼쪽에 21개의 캔들스틱과 오른쪽에 8개의 캔들스틱을 사용하여 주요 지지 및 저항 수준을 계산합니다.
  3. 추세 필터로 고수준 기간 이동 평균 소개
  4. 단기(5기간) 및 장기(30기간) 이동평균을 결합하여 진입 시점 결정
  5. ATR을 사용하여 손절매 위치를 동적으로 조정합니다.

전략적 이점

  1. 다차원 기술 지표는 서로를 검증하고 거짓 신호를 효과적으로 줄입니다.
  2. 동적 지원 및 저항 수준은 시장 변화에 적응하기 위해 실시간으로 업데이트됩니다.
  3. 상위 수준의 기간 분석을 통해 2차 시장 동향을 필터링합니다.
  4. 다양한 기간에 따라 손절매 매개변수를 유연하게 조정합니다.
  5. 위험을 효과적으로 통제하기 위해 백분율 포지션 관리를 활용하세요

전략적 위험

  1. 변동성이 큰 시장에서는 빈번한 거래 신호가 생성될 수 있습니다.
  2. 여러 지표 검증으로 인해 일부 거래 기회를 놓칠 수 있습니다.
  3. 매개변수 최적화에는 과적합의 위험이 있습니다.
  4. 변동성이 높은 환경에서는 정지 폭이 너무 넓을 수 있습니다.
  5. 시장이 급격하게 변할 경우 지지 및 저항 수준이 무효화될 수 있습니다.

전략 최적화 방향

  1. 돌파구의 효과성을 판단하는 데 도움이 되는 볼륨 지표 소개
  2. 시장 변동성 분석 모듈을 추가하고 매개변수를 동적으로 조정합니다.
  3. 지지 및 저항 수준 계산 방법을 최적화하여 정확도 향상
  4. 추세 강도 판단 추가 및 진입 조건 세분화
  5. 보다 정교한 위험 관리를 달성하기 위해 직위 관리 시스템을 개선합니다.

요약하다

이는 완전한 구조와 엄격한 논리를 갖춘 양적 거래 전략입니다. 다양한 기술적 지표를 조화롭게 활용함으로써 거래 신호의 신뢰성이 보장되고 효과적인 위험 관리가 달성됩니다. 이 전략은 강력한 확장성을 가지고 있으며, 지속적인 최적화와 개선을 통해 다양한 시장 환경에서 안정적인 성과를 유지할 것으로 기대됩니다.

전략 소스 코드
/*backtest
start: 2024-12-17 00:00:00
end: 2024-12-21 00:00:00
period: 1h
basePeriod: 1h
exchanges: [{"eid":"Futures_Binance","currency":"BTC_USDT","balance":49999}]
*/

// This Pine Script™ code is subject to the terms of the Mozilla Public License 2.0 at https://mozilla.org/MPL/2.0/
// © sathcm
//@version=5 
strategy("KMS", overlay=true, initial_capital=100000, default_qty_type=strategy.percent_of_equity, default_qty_value=100, commission_type=strategy.commission.percent, commission_value=0.05, slippage=3)

// Inputs for Keltner Channels
kcLength = input.int(21, title="Keltner Channel Length", minval=1)  // Length for Keltner Channel calculation
kcMultiplier = input.float(2.0, title="Keltner Channel Multiplier", minval=0.1)  // Multiplier for Keltner Channel width

// Calculate Keltner Channels using best practices
kcBasis = ta.ema(close, kcLength)  // Use EMA for a smoother basis line
atrValue = ta.atr(kcLength)  // Use ATR for channel width calculation
kcUpper = kcBasis + kcMultiplier * atrValue  // Upper Keltner Channel
kcLower = kcBasis - kcMultiplier * atrValue  // Lower Keltner Channel

// Inputs for Pivot Point Calculation
leftBars = input.int(21, title="Left Bars", minval=1)  // Number of bars to the left for pivot calculation
rightBars = input.int(8, title="Right Bars", minval=1, tooltip="Number of bars to the right for pivot calculation")  // Number of bars to the right for pivot calculation

// Calculate Smoothed Pivot Highs and Lows using Weighted Moving Average
pivotHigh = ta.pivothigh(high, leftBars, rightBars)  // Apply WMA for smoothing
pivotLow = ta.pivotlow(low, leftBars, rightBars)  // Apply WMA for smoothing

// Convert Pivot Highs and Lows to Boolean Conditions
isPivotHigh = not na(pivotHigh)  // True when a pivot high exists
isPivotLow = not na(pivotLow)  // True when a pivot low exists

// Get Recent Support and Resistance Levels
recentResistance = ta.valuewhen(isPivotHigh, high, 0)  // Most recent resistance level
recentSupport = ta.valuewhen(isPivotLow, low, 0)  // Most recent support level

// Plot Smoothed Support and Resistance Levels
//plot(recentResistance, color=color.red, title="Recent Resistance", linewidth=2, style=plot.style_line)
//plot(recentSupport, color=color.green, title="Recent Support", linewidth=2, style=plot.style_line)

// Store Entry Price into a Variable
var float entryPrice = na  // Declare a variable to store the entry price

// Input for Higher Timeframe
higherTimeframeInput = input.timeframe('W', title="Higher Timeframe for MA Calculation")

if (timeframe.period == "240") or (timeframe.period == "120")
    higherTimeframeInput := "D"
if (timeframe.period == "60") or (timeframe.period == "30") or (timeframe.period == "15")
    higherTimeframeInput := "120"
if (timeframe.period == "10") or (timeframe.period == "5") 
    higherTimeframeInput := "30"
if (timeframe.period == "1")
    higherTimeframeInput := "10"

prd = input.int(defval=10, title='Pivot Period', minval=4, maxval=30, group='Settings 🔨', tooltip='Used while calculating Pivot Points, checks left&right bars')
ppsrc = input.string(defval='High/Low', title='Source', options=['High/Low', 'Close/Open'], group='Settings 🔨', tooltip='Source for Pivot Points')
ChannelW = input.int(defval=5, title='Maximum Channel Width %', minval=1, maxval=8, group='Settings 🔨', tooltip='Calculated using Highest/Lowest levels in 300 bars')
minstrength = input.int(defval=1, title='Minimum Strength', minval=1, group='Settings 🔨', tooltip='Channel must contain at least 2 Pivot Points')
maxnumsr = input.int(defval=4, title='Maximum Number of S/R', minval=1, maxval=10, group='Settings 🔨', tooltip='Maximum number of Support/Resistance Channels to Show') - 1
loopback = input.int(defval=150, title='Loopback Period', minval=100, maxval=400, group='Settings 🔨', tooltip='While calculating S/R levels it checks Pivots in Loopback Period')
res_col = input.color(defval=color.new(color.red, 75), title='Resistance Color', group='Colors 🟡🟢🟣')
sup_col = input.color(defval=color.new(color.lime, 75), title='Support Color', group='Colors 🟡🟢🟣')
inch_col = input.color(defval=color.new(color.gray, 75), title='Color When Price in Channel', group='Colors 🟡🟢🟣')

// Get Pivot High/Low
src1 = ppsrc == 'High/Low' ? high : math.max(close, open)
src2 = ppsrc == 'High/Low' ? low : math.min(close, open)
ph = ta.pivothigh(src1, prd, prd)
pl = ta.pivotlow(src2, prd, prd)

// Calculate maximum S/R channel width
prdhighest = ta.highest(300)
prdlowest = ta.lowest(300)
cwidth = (prdhighest - prdlowest) * ChannelW / 100

// Get/keep Pivot levels
var pivotvals = array.new_float(0)
var pivotlocs = array.new_float(0)
if ph or pl
    array.unshift(pivotvals, ph ? ph : pl)
    array.unshift(pivotlocs, bar_index)
    for x = array.size(pivotvals) - 1 to 0 by 1
        if bar_index - array.get(pivotlocs, x) > loopback  // remove old pivot points
            array.pop(pivotvals)
            array.pop(pivotlocs)
            continue
        break

// Find/create SR channel of a pivot point
get_sr_vals(ind) =>
    float lo = array.get(pivotvals, ind)
    float hi = lo
    int numpp = 0
    for y = 0 to array.size(pivotvals) - 1 by 1
        float cpp = array.get(pivotvals, y)
        float wdth = cpp <= hi ? hi - cpp : cpp - lo
        if wdth <= cwidth  // fits the max channel width?
            if cpp <= hi
                lo := math.min(lo, cpp)
            else
                hi := math.max(hi, cpp)
            numpp += 20  // each pivot point added as 20
    [hi, lo, numpp]

// Keep old SR channels and calculate/sort new channels if we met new pivot point
var suportresistance = array.new_float(20, 0)  // min/max levels
changeit(x, y) =>
    tmp = array.get(suportresistance, y * 2)
    array.set(suportresistance, y * 2, array.get(suportresistance, x * 2))
    array.set(suportresistance, x * 2, tmp)
    tmp := array.get(suportresistance, y * 2 + 1)
    array.set(suportresistance, y * 2 + 1, array.get(suportresistance, x * 2 + 1))
    array.set(suportresistance, x * 2 + 1, tmp)

if ph or pl
    supres = array.new_float(0)  // number of pivot, strength, min/max levels
    stren = array.new_float(10, 0)
    // Get levels and strengths
    for x = 0 to array.size(pivotvals) - 1 by 1
        [hi, lo, strength] = get_sr_vals(x)
        array.push(supres, strength)
        array.push(supres, hi)
        array.push(supres, lo)

    // Add each HL to strength
    for x = 0 to array.size(pivotvals) - 1 by 1
        h = array.get(supres, x * 3 + 1)
        l = array.get(supres, x * 3 + 2)
        s = 0
        for y = 0 to loopback by 1
            if high[y] <= h and high[y] >= l or low[y] <= h and low[y] >= l
                s += 1
        array.set(supres, x * 3, array.get(supres, x * 3) + s)

    // Reset SR levels
    array.fill(suportresistance, 0)
    // Get strongest SRs
    src = 0
    for x = 0 to array.size(pivotvals) - 1 by 1
        stv = -1.  // value
        stl = -1  // location
        for y = 0 to array.size(pivotvals) - 1 by 1
            if array.get(supres, y * 3) > stv and array.get(supres, y * 3) >= minstrength * 20
                stv := array.get(supres, y * 3)
                stl := y
        if stl >= 0
            // Get SR level
            hh = array.get(supres, stl * 3 + 1)
            ll = array.get(supres, stl * 3 + 2)
            array.set(suportresistance, src * 2, hh)
            array.set(suportresistance, src * 2 + 1, ll)
            array.set(stren, src, array.get(supres, stl * 3))

            // Make included pivot points' strength zero
            for y = 0 to array.size(pivotvals) - 1 by 1
                if array.get(supres, y * 3 + 1) <= hh and array.get(supres, y * 3 + 1) >= ll or array.get(supres, y * 3 + 2) <= hh and array.get(supres, y * 3 + 2) >= ll
                    array.set(supres, y * 3, -1)

            src += 1
            if src >= 10
                break

    for x = 0 to 8 by 1
        for y = x + 1 to 9 by 1
            if array.get(stren, y) > array.get(stren, x)
                tmp = array.get(stren, y)
                array.set(stren, y, array.get(stren, x))
                changeit(x, y)

get_level(ind) =>
    float ret = na
    if ind < array.size(suportresistance)
        if array.get(suportresistance, ind) != 0
            ret := array.get(suportresistance, ind)
    ret

get_color(ind) =>
    color ret = na
    if ind < array.size(suportresistance)
        if array.get(suportresistance, ind) != 0
            ret := array.get(suportresistance, ind) > close and array.get(suportresistance, ind + 1) > close ? res_col : array.get(suportresistance, ind) < close and array.get(suportresistance, ind + 1) < close ? sup_col : inch_col
    ret

// var srchannels = array.new_box(10)
// for x = 0 to math.min(9, maxnumsr) by 1
//     box.delete(array.get(srchannels, x))
//     srcol = get_color(x * 2)
//     if not na(srcol)
//         array.set(srchannels, x, box.new(left=bar_index, top=get_level(x * 2), right=bar_index + 1, bottom=get_level(x * 2 + 1), border_color=srcol, border_width=1, extend=extend.both, bgcolor=srcol))

// Improved dynamic support detection
float recentSupport1 = na
float previousSupport = na
float currentsupport = na

if na(previousSupport) or currentsupport != previousSupport
    if array.size(suportresistance) > 1 
        for i = 0 to math.floor(array.size(suportresistance) / 2) - 1  // Iterate through support levels
            currentsupport := array.get(suportresistance, i * 2 + 1)  // Support is stored at odd indices
            if currentsupport < close and (na(recentSupport1) or math.abs(close - currentsupport) < math.abs(close - recentSupport1))
                previousSupport := currentsupport  // Store the newly detected support
                  // Set the most recent support to the new support
                recentSupport1 := na(recentSupport1) ? ta.lowest(low, 10) : currentsupport
// Moving averages for entry and exit
maShort = ta.sma(close, 5)
maLong = ta.sma(close, 30) + ta.atr(14)
// Track entry price
entryPrice1 = strategy.position_avg_price  // Get the price of the currently open position
currentTimeFrame = timeframe.period
exitPrice = entryPrice1 * 0.99

if currentTimeFrame == "1H" or currentTimeFrame == "30" or currentTimeFrame == "15" or currentTimeFrame == "5"
    exitPrice := entryPrice1 * 0.99  // Set the exit price at 99% of the entry price

if currentTimeFrame == "120" or currentTimeFrame == "180" or currentTimeFrame == "240" or currentTimeFrame == "D"
    exitPrice := entryPrice1 * 0.98 // Set the exit price at 95% of the entry price


// Calculate Moving Average based on higher timeframe for length of 20 bars
higherTimeframeMA = request.security(syminfo.tickerid, higherTimeframeInput, ta.sma(close, 20), barmerge.gaps_off, barmerge.lookahead_on)  // Calculate MA with adjusted timeframe

// Entry and Exit Conditions for Long
entryLong = (close > kcUpper) and (close > recentResistance) and (close > higherTimeframeMA)  // Long entry when price breaks above KC upper, recent resistance, and higher timeframe MA
exitLong = (close < recentResistance - 1.5*atrValue)  // Long exit when price falls below recent resistance with cushion of one ATR

// Entry and Exit Conditions for Short
entryShort = (close < kcLower) and (close < recentSupport) and (close < higherTimeframeMA+atrValue) // Add RSI filter to reduce false signals by confirming momentum  // Short entry when price breaks below KC lower, recent support, and higher timeframe MA
exitShort = (close > recentSupport + atrValue)  // Short exit when price rises above recent support with cushion of one ATR(close > recentSupport + atrValue)  // Short exit when price rises above recent support with cushion of one ATR(close > recentSupport + atrValue)  // Short exit when price rises above recent support with cushion of one ATR

// Strategy Execution for Long
if not na(recentSupport1) and (close <= recentSupport1 +(close*0.01) or close >= recentSupport1 - (close*0.0075)) and (maShort > maLong) and entryLong
    strategy.entry("Long Entry", strategy.long)
    //entryPrice := strategy.position_avg_price  // Store the entry price when a position is opened

if ((maShort < maLong + 3*ta.atr(14)) or  close < exitPrice) and exitLong
    strategy.close("Long Entry")

// Strategy Execution for Short
if entryShort
    strategy.entry("Short Entry", strategy.short)
    entryPrice := strategy.position_avg_price  // Store the entry price when a position is opened

if exitShort
    strategy.close("Short Entry")

// Plot Keltner Channels
plot(kcUpper, color=color.orange, title="Keltner Channel Upper", linewidth=1)
plot(kcLower, color=color.orange, title="Keltner Channel Lower", linewidth=1)

// Plot Moving Averages
plot(higherTimeframeMA, color=color.blue, title="Higher Timeframe MA", linewidth=2)

//plot(recentSupport1, color=#04313f, title="Recent Support1")
//plot(recentResistance, color=color.purple, title="Recent Resistance")
//plot(entryPrice1, color=color.lime, title="Entry Price 1")
//plot(exitPrice, color=color.maroon, title="Exit Price")
//plot(maShort, color=color.green, title="MA Short")
//plot(maLong, color=color.blue, title="MA Long Plus ATR")

// Highlight Entry Zones
bgcolor(entryLong ? color.new(color.green, 85) : na, title="Long Entry Zone")
bgcolor(entryShort ? color.new(color.red, 85) : na, title="Short Entry Zone")

// Alerts
alertcondition(entryLong, title="Long Entry", message="Price broke above the Keltner Channel and recent resistance for Long Entry")
alertcondition(exitLong, title="Long Exit", message="Price fell below recent resistance with cushion of one ATR - Long Exit")
alertcondition(entryShort, title="Short Entry", message="Price broke below the Keltner Channel and recent support for Short Entry")
alertcondition(exitShort, title="Short Exit", message="Price rose above recent support with cushion of one ATR - Short Exit")