
1
Follow
1781
Followers
개요
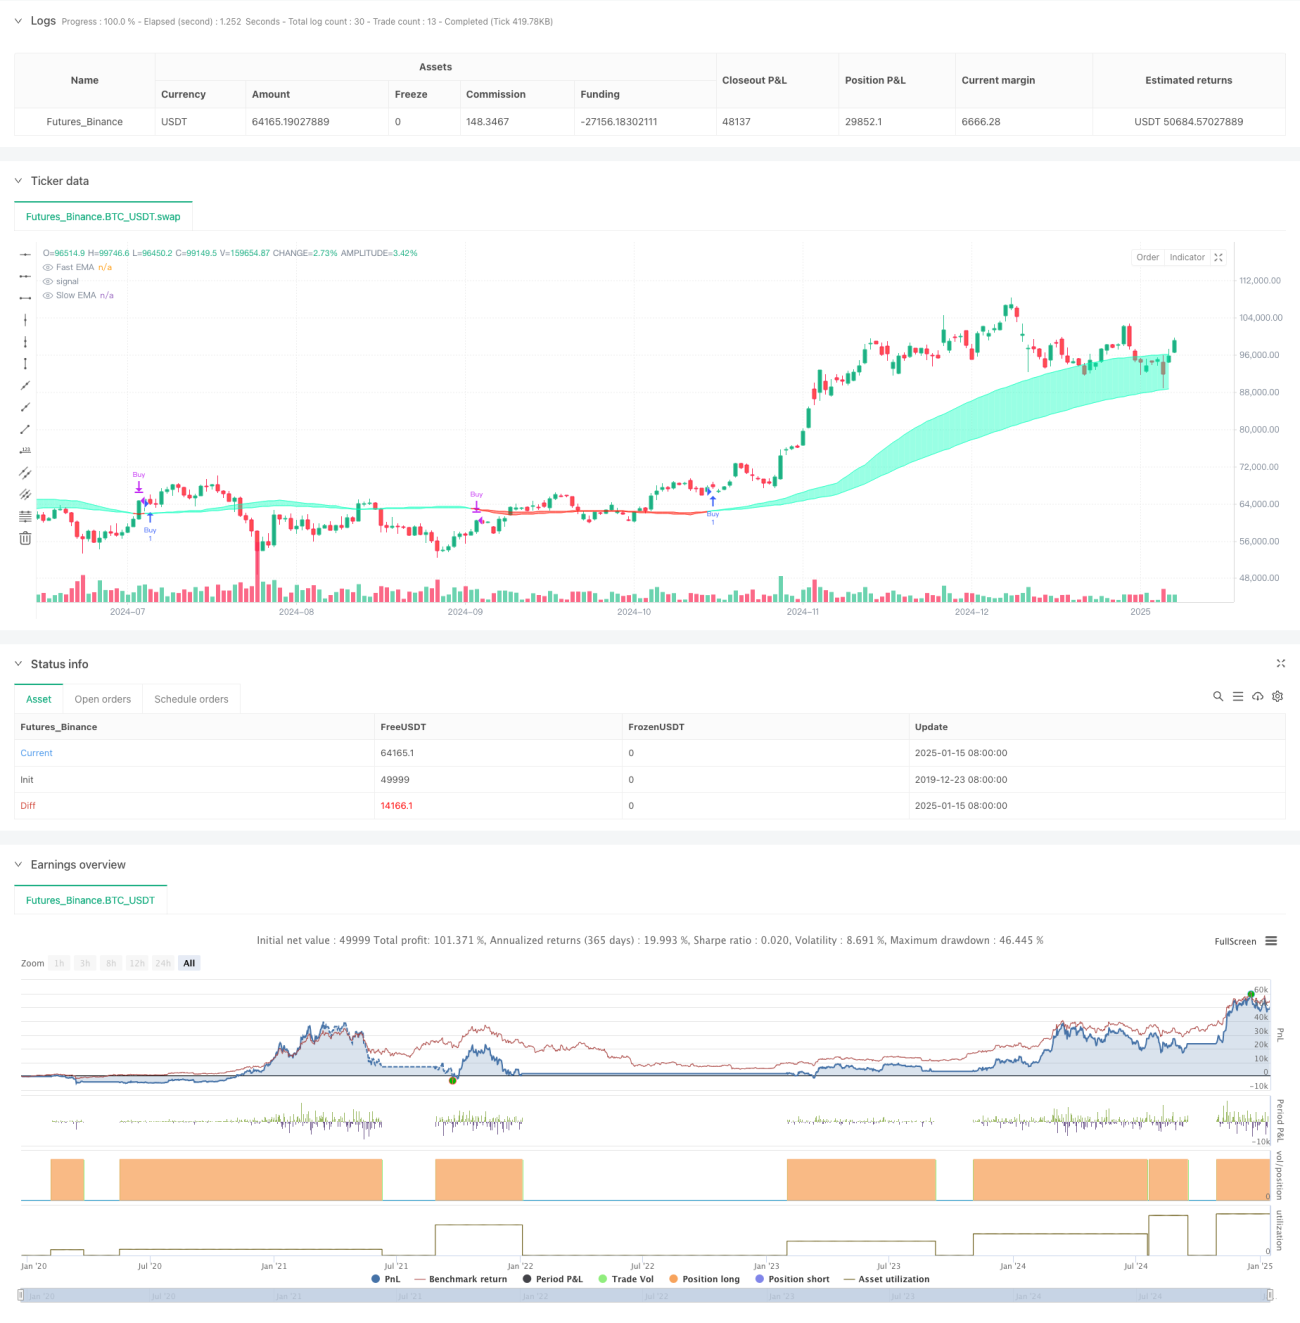
이 전략은 유동성 가중 이동 평균을 기반으로 하는 거래 시스템입니다. 가격 변동과 거래량 간의 관계를 모니터링하여 시장 유동성을 측정하고 이를 기반으로 빠르고 느린 이동 평균을 구성합니다. 빠른 선이 느린 선을 위로 교차할 때 매수 신호가 생성되고, 아래로 교차할 때 매도 신호가 생성됩니다. 이 전략은 비정상적인 유동성 사건에 특별한 주의를 기울이고 배열을 통해 주요 가격 포인트를 기록하여 더 정확한 거래 기회를 제공합니다.
전략 원칙
전략의 핵심은 거래량과 가격 변화율의 비율을 통해 시장 유동성을 측정하는 것입니다. 구체적인 구현 단계는 다음과 같습니다.
- 유동성 지표 계산 : 종가와 시가 차이의 절대값으로 나눈 거래량을 사용
- 유동성 경계 설정: EMA 및 표준 편차를 사용한 비정상적 유동성 식별
- 가격 배열 유지: 유동성 경계를 돌파할 때의 가격을 기록합니다.
- 이동 평균 구축: 유동성 이벤트에 기반한 빠른 EMA 및 느린 EMA 계산
- 거래 신호 생성: 이동 평균 교차를 통해 매수 및 매도 시점 결정
전략적 이점
- 유동성 인식: 거래량과 가격 변화를 결합하면 시장 활동을 보다 정확하게 파악할 수 있습니다.
- 비정상 이벤트 추적: 중요한 시장 기회를 놓치지 않도록 배열을 통해 주요 가격 포인트를 기록합니다.
- 동적 적응: EMA의 무게 감소 기능을 통해 전략이 시장 변화에 더 잘 적응할 수 있습니다.
- 위험 관리: 이동 평균 교차를 통해 명확한 진입 및 종료 신호 제공
- 사용자 정의성: 다양한 시장 환경에 맞게 여러 매개변수를 조정할 수 있습니다.
전략적 위험
- 매개변수 민감도: 전략의 효과는 매개변수 설정에 따라 크게 달라지며 지속적으로 최적화해야 합니다.
- 지연: 이동 평균을 기반으로 하는 시스템에는 고유한 지연이 있습니다.
- 시장 의존성: 특정 기간 및 시장에서 변동성이 있는 성과
- 거짓 브레이크아웃: 변동성이 높은 기간 동안 거짓 신호를 생성할 수 있습니다.
- 거래 비용: 빈번한 거래로 인해 비용이 더 많이 발생할 수 있습니다.
전략 최적화 방향
- 필터를 소개합니다:
- ADX와 같은 추세 확인 지표를 추가합니다.
- 변동성 지표를 사용하여 거짓 신호 걸러내기
- 개선된 진입 타이밍:
- 지지와 저항 수준을 결합
- 볼륨 브레이크아웃 확인을 고려하세요
- 최적화 매개변수 선택:
- 적응형 매개변수 구현
- 시장 상황에 따른 동적 조정
- 강화된 위험 관리:
- 손절매 및 이익실현 메커니즘 추가
- 창고 관리 시스템 구현
요약하다
이는 유동성 분석과 기술 지표를 결합한 혁신적인 전략으로, 시장 유동성 이상 현상을 모니터링하여 기존의 이동평균선 교차 시스템을 최적화합니다. 특정 시장 환경에서는 좋은 성과를 보이지만 안정성과 적용성을 개선하기 위해서는 추가 최적화가 필요합니다. 트레이더는 실시간 사용에 앞서 충분한 테스트를 수행하고 다른 지표와 결합하여 보다 완전한 트레이딩 시스템을 구축하는 것이 좋습니다.
Source
Pine
/*backtest
start: 2019-12-23 08:00:00
end: 2025-01-16 00:00:00
period: 1d
basePeriod: 1d
exchanges: [{"eid":"Futures_Binance","currency":"BTC_USDT","balance":49999}]
*/

//Liquidity ignoring price location

//@version=6
strategy("Liquidity Weighted Moving Averages [AlgoAlpha]", overlay=true, commission_type=strategy.commission.percent, commission_value=0.1, slippage=3)Strategy parameters
Related strategies
Comment
All comments (0)
No data
- 1