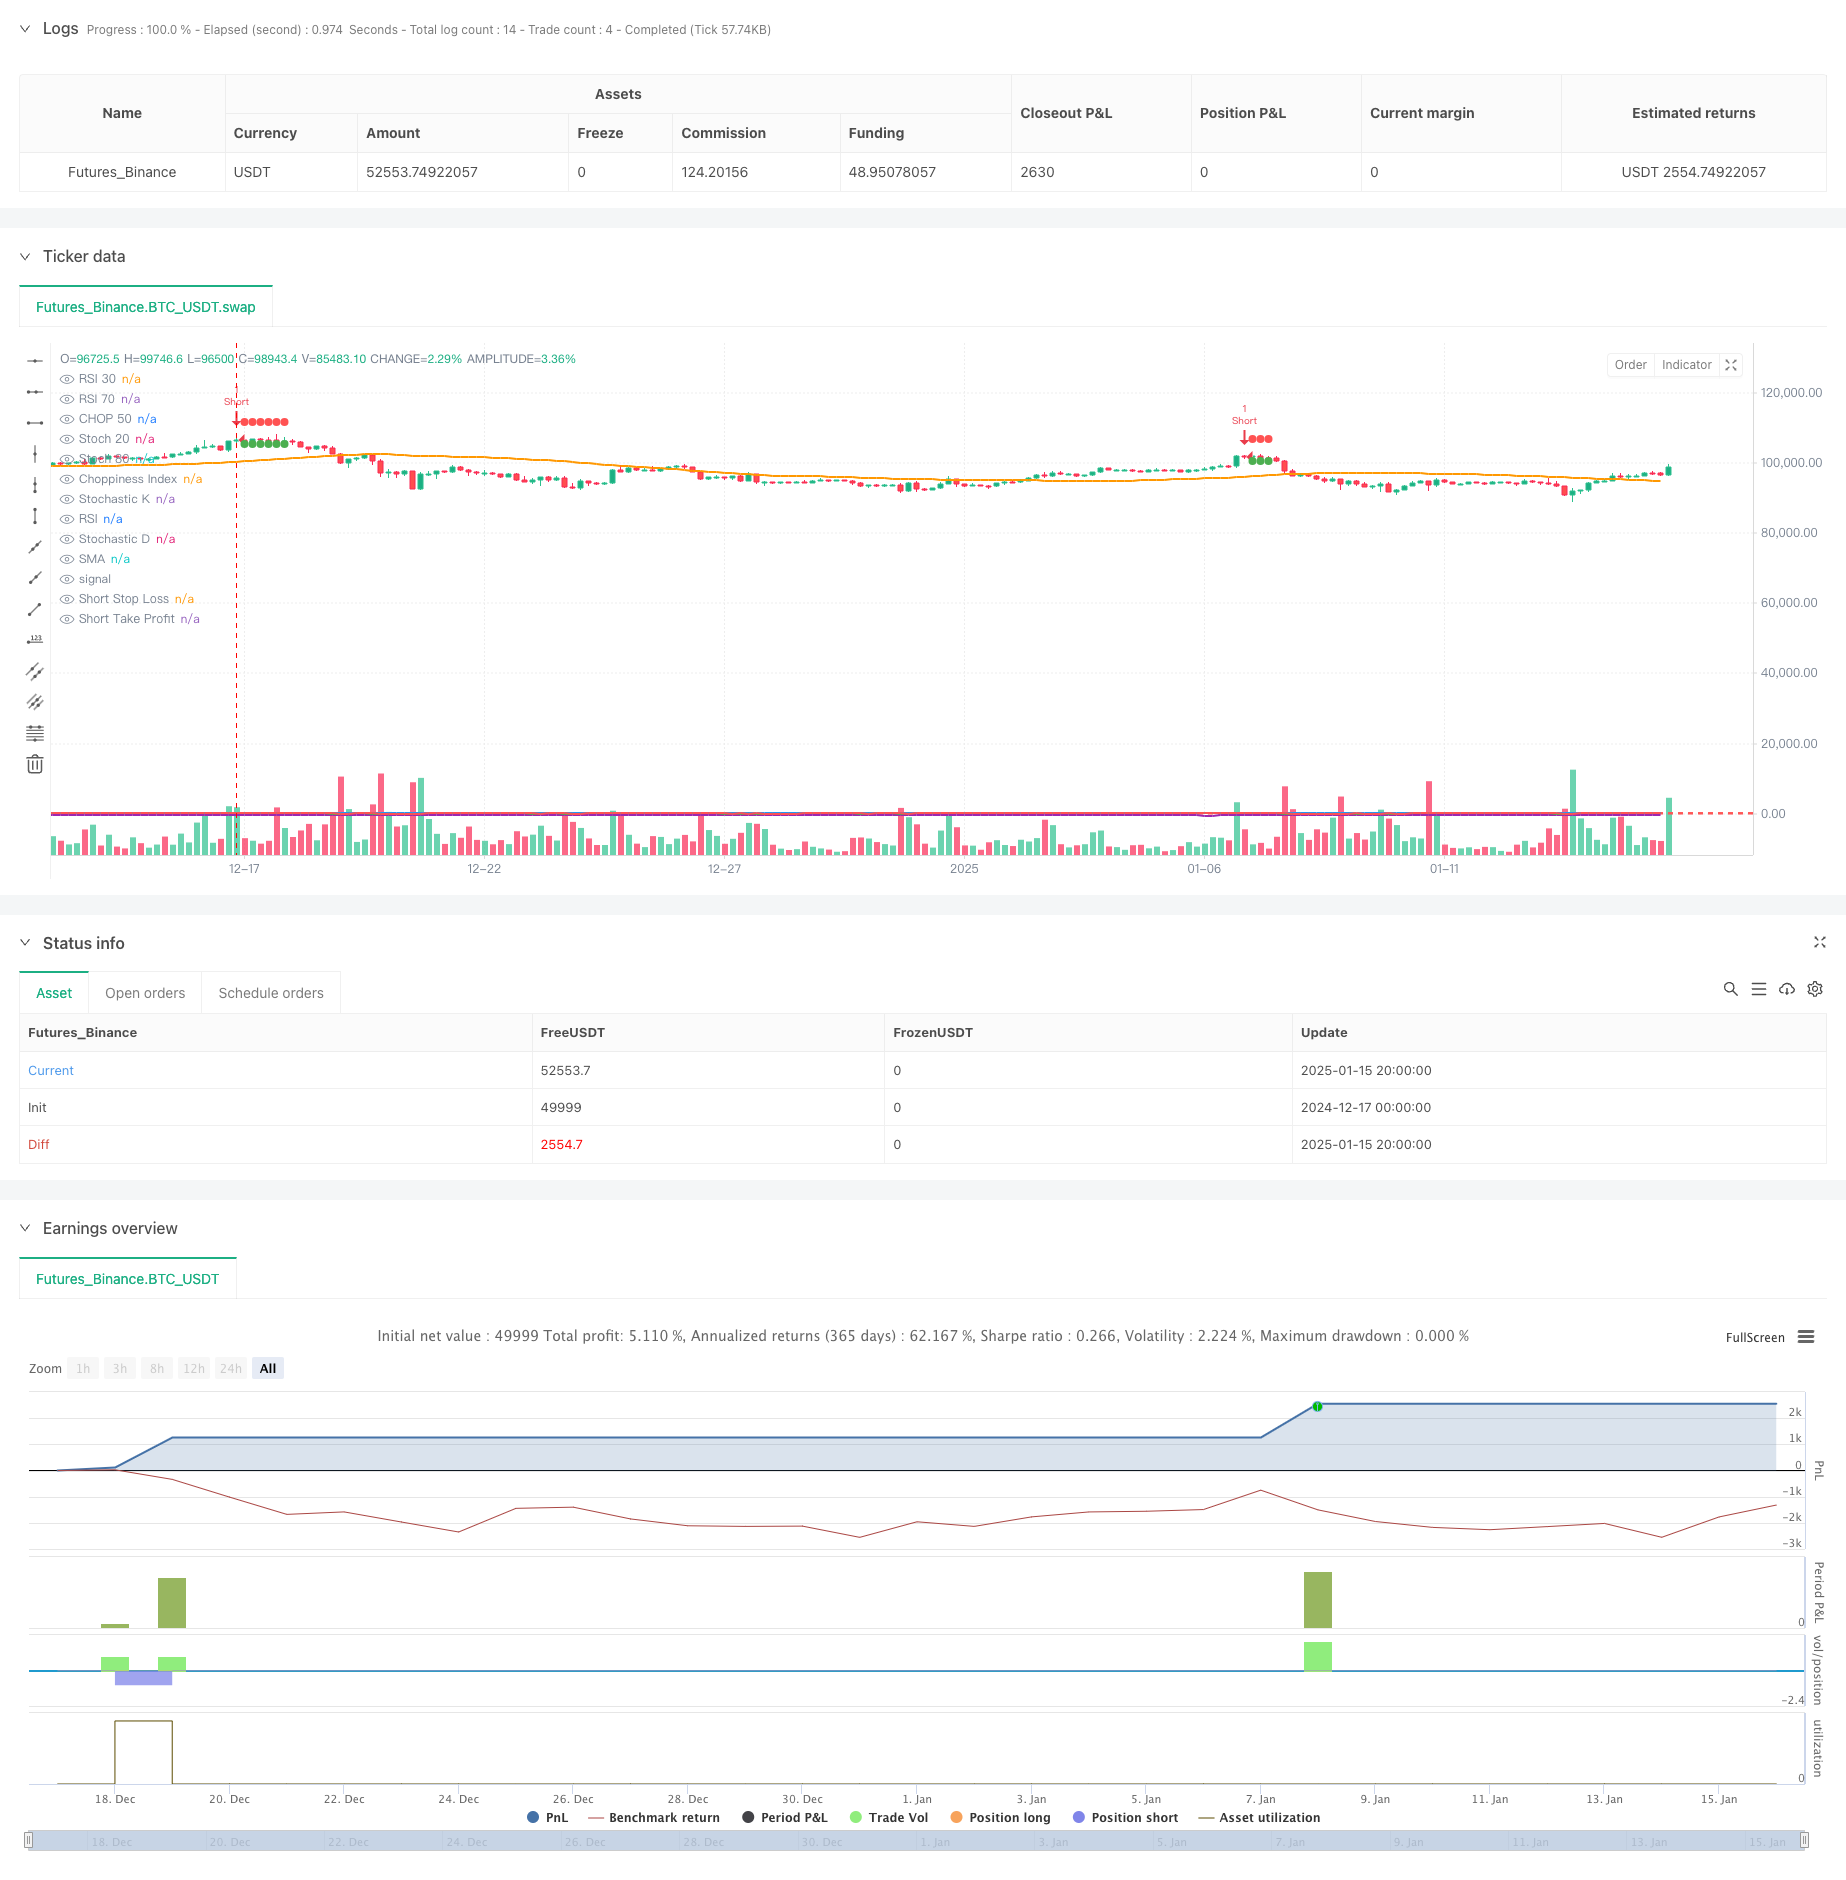
개요
이 전략은 여러 기술 지표를 결합한 자동화된 거래 시스템입니다. 주로 RSI(상대 강도 지수), CHOP(교차 진동 지수) 및 Stochastic의 조정을 통해 시장 동향을 파악하고 동적 손절매 및 손절매를 사용하여 손절매합니다. 시장. 손실 관리 거래 위험. 이 전략은 단기 거래에 5분이라는 기간을 사용하고 다중 지표 교차 검증을 통해 거래의 정확도와 신뢰성을 향상시킵니다.
전략 원칙
이 전략은 추세 결정 및 거래 신호 생성을 위해 4가지 핵심 지표를 사용합니다.
- RSI는 매수 과다 및 매도 과다 조건을 결정하는 데 사용됩니다. RSI < 30은 매도 과다로 간주되고, > 70은 매수 과다로 간주됩니다.
- CHOP 지수는 시장이 충격 상태에 있는지 여부를 판단하는 데 사용됩니다. <50은 명확한 추세를 나타냅니다.
- 스토캐스틱 지표의 K-라인과 D-라인의 교차는 거래 기회를 확인하는 데 사용됩니다.
- SMA(단순 이동 평균)는 전반적인 추세를 결정하는 데 사용됩니다.
거래 규칙은 다음과 같습니다.
- 장기 조건: RSI<30 + CHOP<50 + K라인이 D라인을 교차함
- 공매도 조건: RSI>70 + CHOP<50 + K라인이 D라인 아래로 교차 이 전략은 동적 이익실현 및 손절매 포지션을 백분율로 설정하여 위험 관리를 달성합니다.
전략적 이점
- 다중 지표 교차 검증으로 신호 안정성 향상
- 거짓 신호를 줄이기 위해 CHOP 지수를 통해 변동성 있는 시장을 필터링합니다.
- 동적 손절매 및 손절매 메커니즘은 진입 가격에 따라 자동으로 위험 관리 포지션을 조정합니다.
- 5분 주기 채택으로 단기거래에 적합하며 포지션 리스크 감소
- 인덱스 매개변수는 조정 가능하며 강력한 적응성을 가지고 있습니다.
전략적 위험
- 여러 지표로 인해 거래 신호가 뒤처질 수 있습니다.
- 변동성이 큰 시장에서는 일부 거래 기회를 놓칠 수 있습니다.
- 고정 비율의 손절매 및 이익 실현은 모든 시장 상황에 적합하지 않을 수 있습니다.
- 단기 거래는 시장 소음의 영향을 더 많이 받습니다. 위험을 줄이기 위해 자금 관리 및 포지션 관리를 도입하는 것이 좋습니다.
전략 최적화 방향
- 시장 변동성에 따라 지표 매개변수를 동적으로 조정하기 위한 적응형 매개변수 메커니즘 도입
- 거래 신호의 효율성을 높이기 위해 볼륨 지표 검증을 추가하세요
- 시장 변동성에 따라 위험 관리 수준을 자동으로 조정하기 위해 동적 손절매 및 손절매 알고리즘을 개발합니다.
- 거래 기회 선택을 더욱 최적화하기 위해 추세 강도 필터가 추가되었습니다.
- 높은 변동성 기간을 피하기 위해 시간 필터링을 추가하는 것을 고려하세요
요약하다
이 전략은 여러 지표와 엄격한 위험 관리를 결합해 비교적 완전한 거래 시스템을 구축합니다. 최적화가 필요한 몇몇 영역이 있기는 하지만, 전반적인 디자인 아이디어는 명확하고 실용적인 적용 가치가 있습니다. 지속적인 최적화와 매개변수 조정을 통해 전략의 안정성과 수익성을 더욱 개선할 수 있습니다.
전략 소스 코드
/*backtest
start: 2024-12-17 00:00:00
end: 2025-01-16 00:00:00
period: 4h
basePeriod: 4h
exchanges: [{"eid":"Futures_Binance","currency":"BTC_USDT","balance":49999}]
*/

//@version=5
strategy("RSI + CHOP + Stochastic Strategy", overlay=true)

// Parametry wskaźników
rsiPeriod = input(14, title="RSI Period")
chopPeriod = input(14, title="Choppiness Period")
stochK = input(14, title="Stochastic K Period")
stochD = input(3, title="Stochastic D Period")
stochSmoothK = input(3, title="Stochastic Smooth K Period")
smaPeriod = input(50, title="SMA Period")

// Parametry Take Profit i Stop Loss
longTakeProfitPct = input.float(1.0, title="Long Take Profit %", minval=0.1, step=0.1) / 100
longStopLossPct = input.float(5.0, title="Long Stop Loss %", minval=0.1, step=0.1) / 100
shortTakeProfitPct = input.float(1.0, title="Short Take Profit %", minval=0.1, step=0.1) / 100
shortStopLossPct = input.float(5.0, title="Short Stop Loss %", minval=0.1, step=0.1) / 100

// Obliczenia wskaźników
rsiValue = ta.rsi(close, rsiPeriod)

highLowRange = ta.highest(high, chopPeriod) - ta.lowest(low, chopPeriod)
chopIndex = 100 * math.log10(highLowRange / ta.sma(close, chopPeriod)) / math.log10(2)

stoch = ta.stoch(close, high, low, stochK)
k = stoch[0]
d = stoch[1]

// Obliczenia SMA
smaValue = ta.sma(close, smaPeriod)

// Warunki kupna i sprzedaży
buyCondition = (rsiValue < 30) and (chopIndex < 50) and (ta.crossover(k, d))
sellCondition = (rsiValue > 70) and (chopIndex < 50) and (ta.crossunder(k, d))

var float longStopLevel = na
var float longTakeProfitLevel = na
var float shortStopLevel = na
var float shortTakeProfitLevel = na

// Wejście w pozycję długą
if (buyCondition and na(longStopLevel))
    strategy.entry("Long", strategy.long)
    longStopLevel := na // Zresetuj poziom Stop Loss
    longTakeProfitLevel := na // Zresetuj poziom Take Profit

// Wejście w pozycję krótką
if (sellCondition and na(shortStopLevel))
    strategy.entry("Short", strategy.short)
    shortStopLevel := na // Zresetuj poziom Stop Loss
    shortTakeProfitLevel := na // Zresetuj poziom Take Profit

// Ustaw poziomy Take Profit i Stop Loss na podstawie ceny wejścia w pozycję
if (strategy.position_size > 0 and na(longTakeProfitLevel))
    longStopLevel := strategy.position_avg_price * (1 - longStopLossPct)
    longTakeProfitLevel := strategy.position_avg_price * (1 + longTakeProfitPct)

if (strategy.position_size < 0 and na(shortTakeProfitLevel))
    shortStopLevel := strategy.position_avg_price * (1 + shortStopLossPct)
    shortTakeProfitLevel := strategy.position_avg_price * (1 - shortTakeProfitPct)

// Resetowanie poziomów po wyjściu z pozycji
if (strategy.position_size == 0)
    longStopLevel := na
    longTakeProfitLevel := na
    shortStopLevel := na
    shortTakeProfitLevel := na

// Wyjście z pozycji długiej
if (strategy.position_size > 0)
    strategy.exit("Take Profit", "Long", limit=longTakeProfitLevel, stop=longStopLevel)

// Wyjście z pozycji krótkiej
if (strategy.position_size < 0)
    strategy.exit("Take Profit", "Short", limit=shortTakeProfitLevel, stop=shortStopLevel)

// Oznaczenie poziomów stop loss i take profit na wykresie
plot(series=longStopLevel, title="Long Stop Loss", color=color.red, linewidth=1, style=plot.style_circles)
plot(series=longTakeProfitLevel, title="Long Take Profit", color=color.green, linewidth=1, style=plot.style_circles)
plot(series=shortStopLevel, title="Short Stop Loss", color=color.red, linewidth=1, style=plot.style_circles)
plot(series=shortTakeProfitLevel, title="Short Take Profit", color=color.green, linewidth=1, style=plot.style_circles)

// Wyświetlanie wskaźników na wykresie
plot(rsiValue, title="RSI", color=color.blue, linewidth=2)
hline(30, "RSI 30", color=color.red)
hline(70, "RSI 70", color=color.red)

plot(chopIndex, title="Choppiness Index", color=color.purple, linewidth=2)
hline(50, "CHOP 50", color=color.red)

plot(k, title="Stochastic K", color=color.green, linewidth=2)
plot(d, title="Stochastic D", color=color.red, linewidth=2)
hline(20, "Stoch 20", color=color.red)
hline(80, "Stoch 80", color=color.red)

// Wyświetlanie SMA na wykresie
plot(smaValue, title="SMA", color=color.orange, linewidth=2)