
1
Follow
1780
Followers
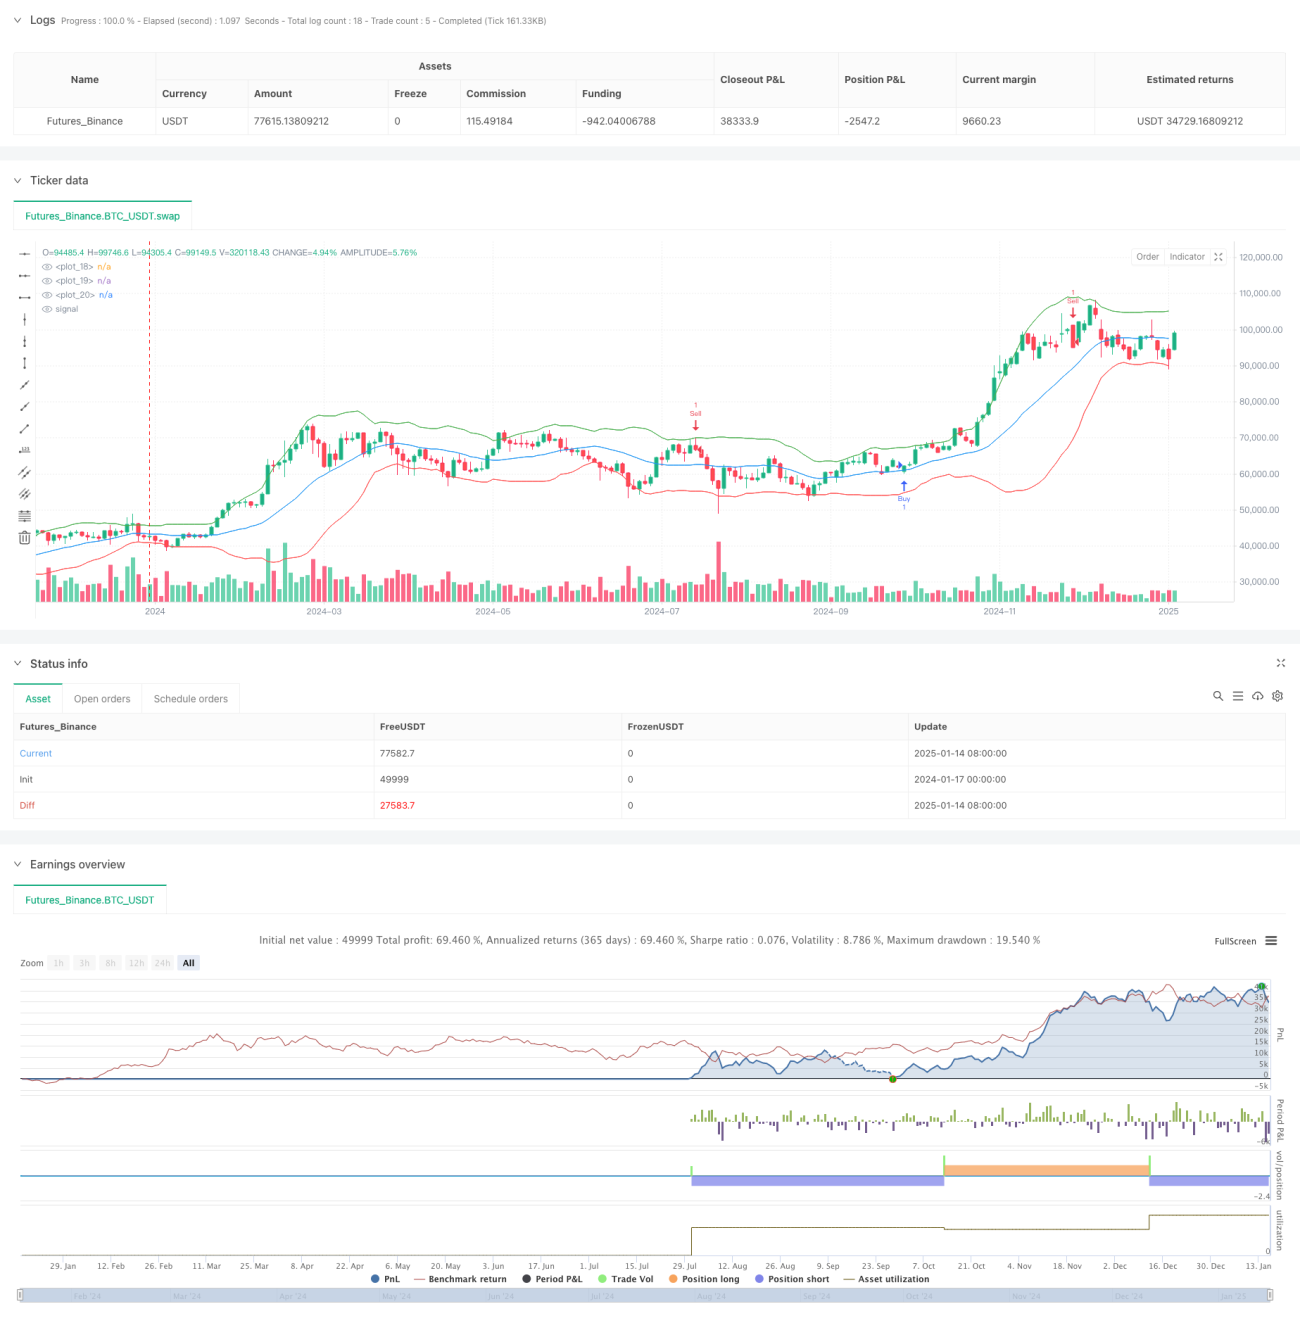
개요
이 전략은 K-최근접 이웃(KNN) 머신 러닝 알고리즘, 캔들스틱 패턴 인식, 거래량 분석을 결합한 포괄적인 거래 시스템입니다. 이 전략은 이동 평균 채널, 거래량 임계값 검증, 확률 통계를 포함한 다차원 분석 방법을 통해 시장에 대한 3차원 분석 프레임워크를 형성하여 잠재적인 거래 기회를 포착합니다.
전략 원칙
전략의 핵심 논리는 다음과 같은 핵심 요소에 기초합니다.
- 이동 평균(SMA)과 표준 편차를 사용하여 매수 과다 및 매도 과다 영역을 식별하기 위한 가격 채널을 구성합니다.
- 망치형, 유성형, 삼키기형 등을 포함하여 프로그래밍 방식으로 정의된 조건을 통해 9가지의 고전적인 촛대 패턴을 식별합니다.
- 과거 가격 추세를 학습하고 가능한 미래 가격 추세를 예측하기 위해 KNN 알고리즘을 소개합니다.
- 거래량을 신호 확인 지표로 사용하려면 신호가 트리거될 때 거래량이 설정된 임계값보다 높아야 합니다.
- 상승 및 하강의 확률 분포를 계산하여 신호 필터링 조건 중 하나로 활용
전략적 이점
- 다중 레벨 신호 확인 메커니즘으로 거래의 신뢰성이 크게 향상됩니다.
- KNN 알고리즘의 도입은 기존 기술 분석에 대한 머신 러닝 관점을 제공합니다.
- 볼륨 검증 메커니즘은 거짓 돌파구를 효과적으로 방지합니다.
- 지지선과 저항선을 동적으로 그리면 중요한 가격 수준을 식별하는 데 도움이 됩니다.
- 포괄적인 경고 시스템을 통해 중요한 거래 기회를 놓치지 않도록 보장합니다.
- 전략 매개변수는 매우 조정 가능하며 다양한 시장 환경에 적응할 수 있습니다.
전략적 위험
- KNN 알고리즘은 변동성이 큰 시장에서는 뒤떨어질 수 있습니다.
- 신호 필터링 조건이 너무 많으면 일부 거래 기회를 놓칠 수 있습니다.
- 고정 볼륨 임계값은 다른 기간에 동적으로 조정되어야 할 수도 있습니다.
- 측면 단계 중에 너무 많은 거짓 신호가 생성될 수 있습니다.
추천:
- 알고리즘 매개변수를 동적으로 조정합니다
- 시장환경 식별 메커니즘 소개
- 최대 손실 한도를 설정하세요
- 창고관리시스템 구축
전략 최적화 방향
- 시장 상황에 따라 전략이 매개변수를 자동으로 조정할 수 있도록 하는 적응형 매개변수 조정 메커니즘 도입
- 딥러닝 알고리즘을 통합하여 예측 정확도를 향상시킵니다.
- 더 많은 시장 미시구조 지표 추가
- 거래량 임계값 동적 계산 방식 최적화
- 보다 완벽한 위험관리체계 구축
요약하다
이 전략은 전통적인 기술 분석과 최신 머신 러닝 방법을 결합하여 강력한 거래 시스템을 구축합니다. 이 전략의 다차원적 분석 프레임워크와 엄격한 신호 확인 메커니즘은 거래 결정에 대한 신뢰할 수 있는 기반을 제공합니다. 지속적인 최적화와 위험 관리를 통해 이 전략은 다양한 시장 환경에서도 안정적인 성과를 유지할 것으로 기대됩니다.
Source
Pine
Strategy parameters
Related strategies
Comment
All comments (0)
No data
- 1