동적 추세 결정 RSI 지표 교차 전략

1
Follow
1781
Followers
개요
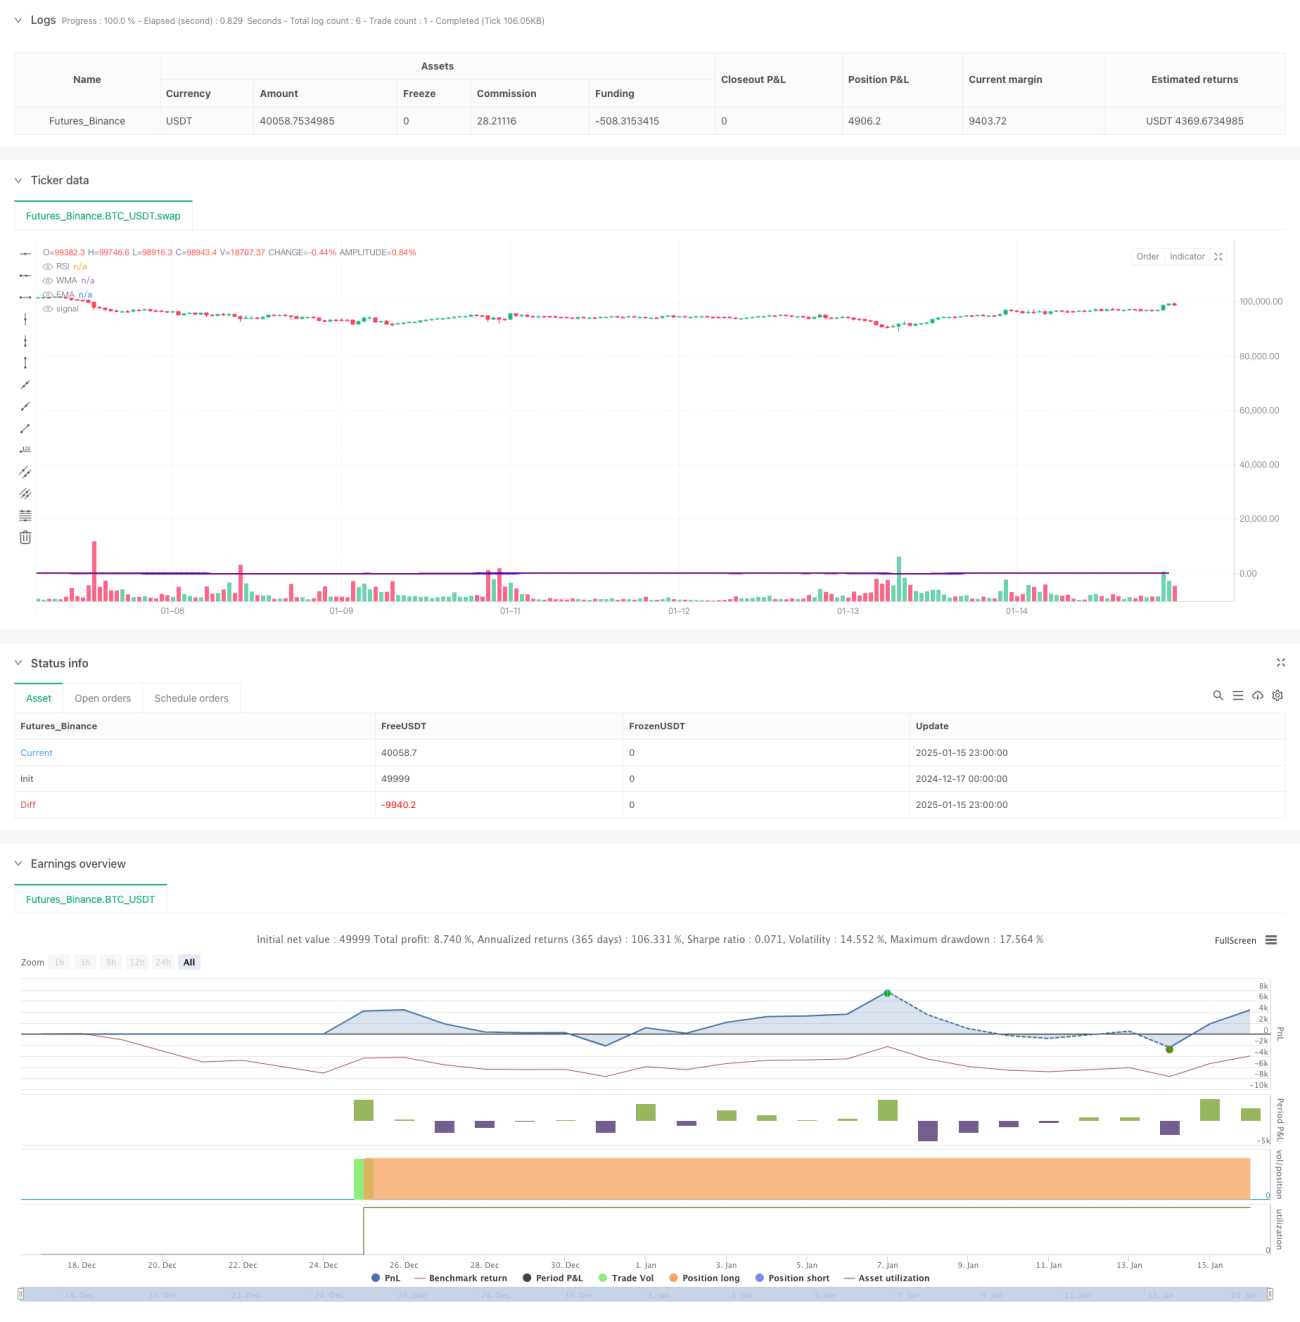
이 전략은 상대 강도 지수(RSI), 가중 이동 평균(WMA), 지수 이동 평균(EMA)을 결합한 추세 추종 거래 시스템입니다. 이 전략은 RSI 값의 위치와 WMA와 EMA의 교차점을 모니터링하여 시장 추세 변화를 파악하고 이를 통해 매수 및 매도 신호를 생성합니다. 이러한 결합 방식은 시장의 매수 과다 및 매도 과다 조건을 고려할 뿐만 아니라, 다양한 기간의 이동 평균선에 대한 추세 판단을 결합하여 시장 전환점을 보다 정확하게 포착할 수 있습니다.
전략 원칙
전략의 핵심 논리는 다음과 같은 핵심 요소에 기초합니다.
- 14기간 RSI 지표를 사용하여 시장의 매수과잉 및 매도과잉 상태를 계산합니다.
- 45주기 WMA와 89주기 EMA를 계산합니다.
- 입장 조건:
- 롱 신호: RSI가 50 미만이고 WMA가 EMA 위를 교차할 때
- 단기 신호: RSI가 50 이상일 때, WMA가 EMA 아래로 교차할 때
- 이 전략은 ta.rma 함수를 사용하여 RSI 계산을 원활하게 하고 신호의 안정성을 개선합니다.
- plotshape 함수를 사용하여 차트에 매수 및 매도 포인트를 표시하면 트레이더가 직관적으로 판단을 내리는 데 편리합니다.
전략적 이점
- 높은 신호 신뢰성: 모멘텀 지표(RSI)와 트렌드 지표(이동 평균)를 결합하여 거짓 신호를 효과적으로 걸러낼 수 있습니다.
- 탁월한 위험 관리: 50일 RSI 라인을 추세 확인으로 사용하면 반대 추세 거래의 위험이 줄어듭니다.
- 강력한 적응성: 전략 매개변수는 매우 조정 가능하며 다양한 시장 환경에 적응할 수 있습니다.
- 명확한 시각화: 거래 신호가 차트에서 명확하게 표시되어 분석 및 백테스트가 쉽습니다.
- 높은 컴퓨팅 효율성: Pine Script의 네이티브 기능 사용, 빠른 컴퓨팅 속도
전략적 위험
- 변동성 있는 시장의 위험: 횡보 및 변동성 있는 시장에서는 빈번하게 잘못된 신호가 발생할 수 있습니다.
- 래그 위험: 이동평균선 자체에는 일정한 래그가 있어 진입 시점이 약간 지연될 수 있습니다.
- 매개변수 민감도: 다양한 기간의 매개변수 설정은 전략 성과에 상당한 영향을 미칠 수 있습니다.
- 시장 환경 의존성: 이 전략은 추세 시장에서 더 나은 성과를 거두지만 변동이 심한 시장에서는 잘 작동하지 않을 수 있습니다.
- 인출 위험: 극심한 변동성 기간 동안 큰 인출에 직면할 수 있습니다.
전략 최적화 방향
- 변동성 필터링 소개: ATR 지표를 추가하면 변동성이 낮은 환경에서 거래 신호를 필터링할 수 있습니다.
- 손절매 설정 최적화: 위험 관리 역량을 개선하기 위해 ATR에 따라 손절매 위치를 동적으로 설정하는 것이 좋습니다.
- 추세 강도 확인 증가: ADX와 같은 추세 강도 지표를 도입하여 거래 신호의 신뢰성을 향상시킬 수 있습니다.
- 포지션 관리 개선: 변동성 및 위험 측정에 따라 포지션 크기를 동적으로 조정하는 것이 좋습니다.
- 시장 환경 판단력 향상: 시장 환경 분류 로직을 추가하고 다양한 시장 상황에 따라 다양한 매개변수 설정을 사용할 수 있습니다.
요약하다
이 전략은 RSI, WMA, EMA라는 세 가지 기술 지표를 결합하여 비교적 완전한 추세 추적 시스템을 구축합니다. 이 전략의 핵심적인 장점은 신호의 신뢰성과 위험 관리 능력에 있지만, 동시에 변동성이 큰 시장에서는 거짓 신호의 위험에도 주의해야 합니다. 변동성 필터링, 추세 강도 확인과 같은 최적화 조치를 추가함으로써 전략의 안정성과 수익성을 더욱 개선할 수 있습니다. 전반적으로 이는 실용적인 가치가 있는 거래 전략이며, 특히 중기 및 장기 추세 거래자에게 적합합니다.
Source
Pine
Strategy parameters
Related strategies
Comment
All comments (0)
No data
- 1