
1
Follow
1802
Followers
개요
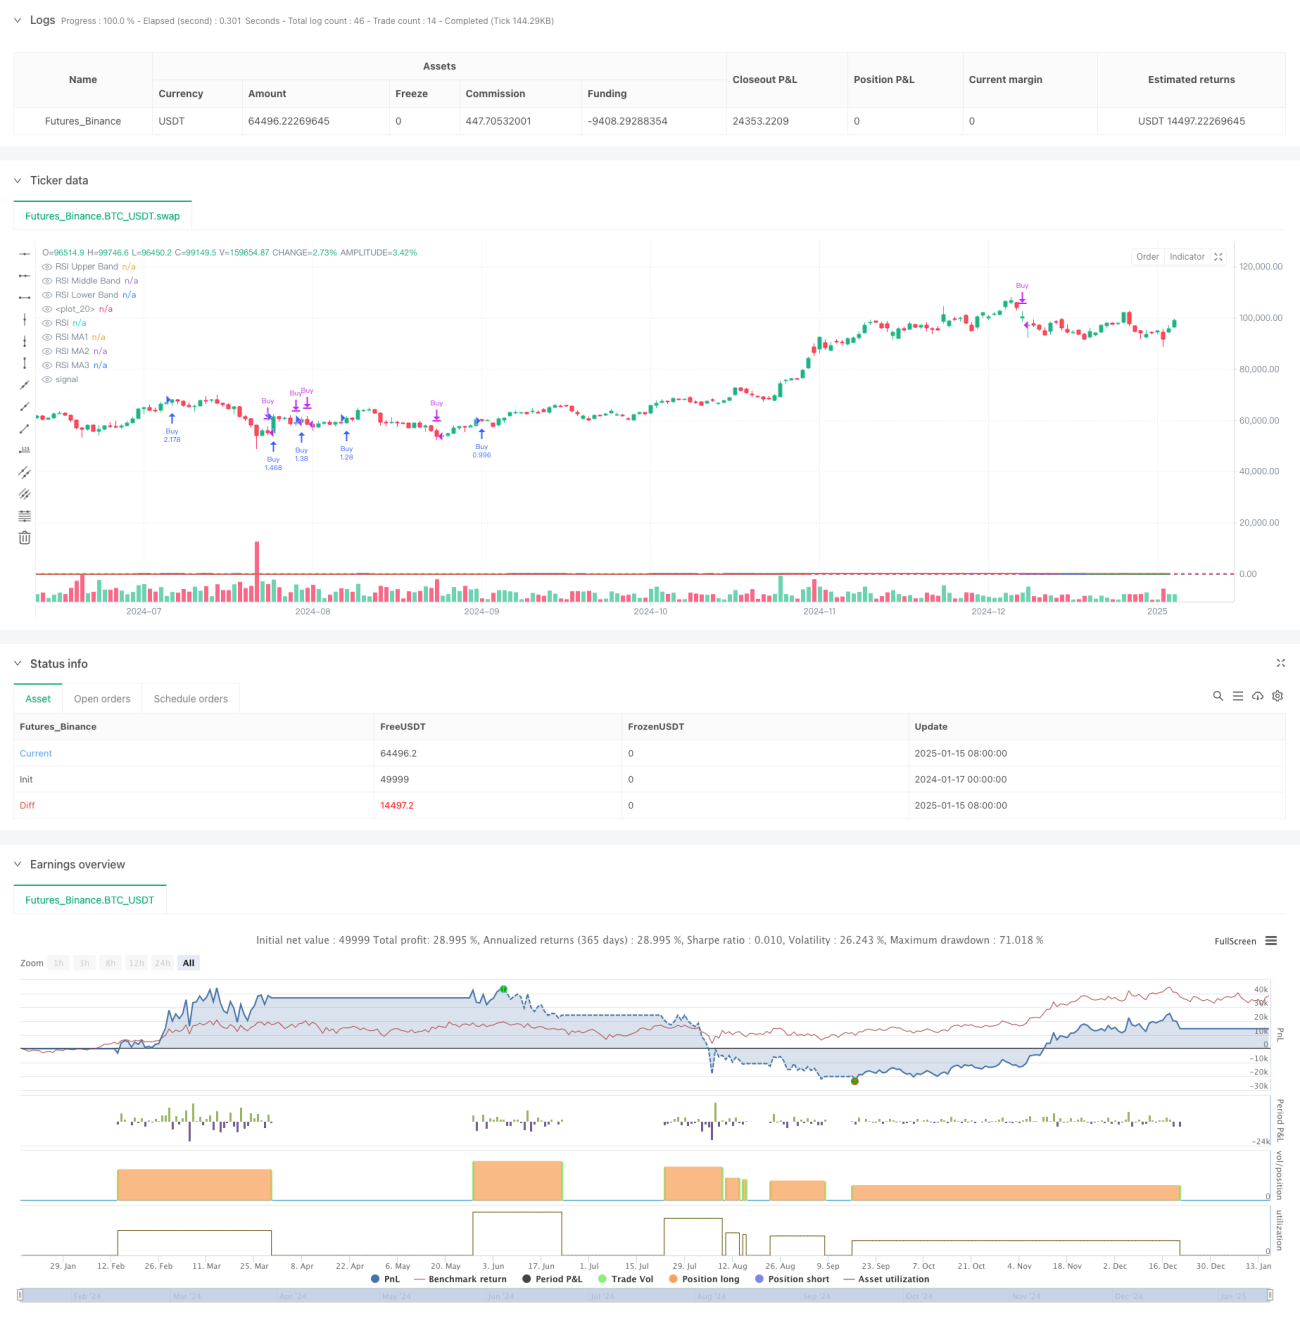
이는 상대강도지수(RSI)와 여러 이동평균선을 결합한 퀀트 트레이딩 전략입니다. 이 전략은 주로 RSI 지표 위에서 다양한 유형의 이동평균선(SMA, EMA, WMA, SMMA 포함)의 교차 신호를 모니터링하여 시장 추세를 판단하고, 동시에 RSI 지표 자체의 과매수/과매도 구간을 보조 판단 근거로 활용하여 매매 타이밍을 결정합니다.
전략 원리
전략은 주로 다음과 같은 주요 계산 단계를 포함합니다:
- 14주기 RSI 지표를 계산하고, 과매수 영역을 70, 과매도 영역을 30으로 설정합니다.
- RSI 곡선 위에 각각 다른 파라미터를 가진 3개의 이동평균선을 계산합니다:
- MA1: 20주기, SMA/EMA/WMA/SMMA 선택 가능
- MA2: 50주기, SMA/EMA/WMA/SMMA 선택 가능
- MA3: 100주기, SMA/EMA/WMA/SMMA 선택 가능
- 거래 신호 생성 규칙:
- 매수 신호: MA2가 MA3를 상향 돌파할 때
- 매도 신호: MA2가 MA3를 하향 돌파할 때
- 동시에 RSI 지표의 다이버전스(divergence)를 감지하여 거래 결정에 보조 참고 자료를 제공합니다.
전략 장점
- 다중 기술 지표 교차 검증으로 거래 신호의 신뢰성 향상
- 이동평균선 유형과 파라미터 조정 가능, 유연성이 뛰어남
- RSI 다이버전스 감지 기능으로 시장 전환점을 조기에 발견 가능
- 백분율 포지션 관리 방식을 채택하여 리스크를 효과적으로 통제
- 시각화 효과가 뛰어나 분석 및 백테스트에 용이
전략 리스크
- 이동평균선 교차는 지연 효과(lag effect)를 초래할 수 있음
- 횡보 변동장에서 잦은 가짜 신호가 발생할 수 있음
- 특정 시장 조건에서 RSI 지표의 왜곡 가능성
- 파라미터 선택이 부적절할 경우 너무 많거나 적은 거래 신호 발생
회피 방안:
- 시장 움직임과 거래량을 결합한 교차 검증 권장
- 이동평균선 파라미터 조정을 통해 거래 빈도 최적화 가능
- 손절매와 이익 실현 설정으로 리스크 통제
전략 최적화 방향
- 신호 필터 최적화:
- 추세 확인 지표 추가
- 거래량 분석 도입
- 파라미터 동적 최적화:
- 시장 변동성에 따라 RSI 및 MA 파라미터 자동 조정
- 적응형 주기 계산 방법 도입
- 리스크 관리 최적화:
- 동적 손절매 및 이익 실현 메커니즘 개발
- 포지션 동적 관리 시스템 설계
요약
이 전략은 RSI와 여러 이동평균선을 결합하여 적응성이 뛰어난 거래 시스템을 구축합니다. 전략의 핵심 장점은 다중 기술 지표의 교차 검증과 유연한 파라미터 설정에 있지만, 이동평균선의 지연성과 시장 조건이 전략 성과에 미치는 영향을 주의해야 합니다. 지속적인 최적화와 리스크 관리를 통해 이 전략은 실제 거래에서 안정적인 성과를 거둘 수 있을 것으로 기대됩니다.
Source
Pine
/*backtest
start: 2024-01-17 00:00:00
end: 2025-01-16 00:00:00
period: 1d
basePeriod: 1d
exchanges: [{"eid":"Futures_Binance","currency":"BTC_USDT","balance":49999}]
*/

//@version=6
strategy(title="Relative Strength Index with MA Strategy", shorttitle="RSI-MA Strategy", overlay=true, default_qty_type=strategy.percent_of_equity, default_qty_value=200)

// RSI InputsStrategy parameters
Comment
All comments (0)
No data
- 1