피라미드 포지션 관리 시스템과 결합된 듀얼 기간 RSI 트렌드 모멘텀 강도 전략

1
Follow
1781
Followers
개요
이 전략은 피라미드 방식의 포지션 관리와 결합된 이중 기간 RSI(상대 강도 지수)를 기반으로 하는 추세 추종 거래 시스템입니다. 이 전략은 두 개의 다른 기간(14와 30)의 RSI 지표를 비교하고, 추세가 시작될 때 개입하여 추세가 지속되면 제한 주문을 통해 포지션을 늘려 추세를 최대한 파악합니다. 이 시스템은 포지션 관리 및 동적 청산 조건을 포함한 완벽한 위험 관리 메커니즘을 갖추고 설계되었습니다.
전략 원칙
이 전략은 이중 기간 RSI 교차 신호를 거래 트리거 조건으로 사용하고 이를 피라미드 스타일의 포지션 관리와 결합합니다. 구체적으로:
- 진입 신호: 14기간 RSI를 사용하여 매도 과다(30) 및 매수 과다(70) 수준을 돌파하여 포지션을 개시하는 신호로 사용합니다.
- 포지션 증가 관리: 포지션을 오픈한 후, 가격 편차 1.5%로 제한 주문을 설정하면 두 번째 포지션 증가를 달성할 수 있습니다.
- 마감 신호: 30주기 RSI를 마감 지표로 사용하고 RSI가 매수 과열 영역에서 하락하거나 매도 과열 영역에서 반등할 때 마감을 트리거합니다.
- 위치 제어: 시스템은 최대 2개의 위치(피라미딩=2)를 허용하며, 매번 열리는 위치 수는 독립적으로 설정할 수 있습니다.
전략적 이점
- 강력한 추세 파악 능력: 듀얼 사이클 RSI와의 협력을 통해 중기 및 장기 추세를 더 잘 식별하고 추적할 수 있습니다.
- 위험-수익률 비율 최적화: 추세가 확립된 후 포지션을 추가하여 수익을 확대하기 위해 피라미드 스타일의 포지션 추가 전략을 채택합니다.
- 유연한 포지션 관리 : 시장 상황 및 자본 규모에 따라 오픈 포지션 및 증가 포지션 수 조정 가능
- 동적 손절매 설계: 조기 종료를 방지하기 위해 장기 RSI를 포지션 종료 지표로 사용하세요
- 강력한 매개변수 조정성: 주요 매개변수는 다양한 시장 특성에 따라 최적화되고 조정될 수 있습니다.
전략적 위험
- 변동성 있는 시장 위험: 범위가 제한된 시장에서의 잦은 진입 및 퇴장은 손실로 이어질 수 있습니다.
- 슬리피지 위험: 포지션을 늘리는 주문은 지정가 주문으로 실행되며, 시장이 혼란스러울 때는 포지션을 늘리기 가장 좋은 시기를 놓칠 수 있습니다.
- 펀드 관리 위험: 포지션을 두 배로 늘리면 손실이 더 커질 수 있습니다.
- 추세 반전 위험: RSI 지표에는 어느 정도 지연 시간이 있으며, 추세가 반전되면 제때 손실을 막지 못할 수 있습니다.
- 매개변수 최적화 위험: 과도한 최적화로 인해 실제 거래에서 해당 전략의 성과가 저하될 수 있습니다.
전략 최적화 방향
- 트렌드 필터 도입: 이동 평균선이나 ADX와 같은 트렌드 지표를 추가하여 진입 신호의 신뢰성을 개선할 수 있습니다.
- 포지션 관리 최적화: 변동성에 따라 오픈 포지션 수를 조정하기 위한 동적 포지션 관리 시스템을 설계할 수 있습니다.
- 손절매 메커니즘 개선: 트레일링 손절매 또는 ATR 기반 손절매 솔루션 추가를 고려하세요.
- 시장 환경 필터링 강화: 변동성 지표 도입 및 다양한 시장 환경에서 전략 매개변수 조정
- 포지션 추가를 위한 개선된 로직: 포지션 추가 가격의 편차는 변동성에 따라 동적으로 조정될 수 있습니다.
요약하다
이 전략은 이중 기간 RSI와 피라미드 스타일의 포지션 추가를 결합하여 추세를 잘 파악합니다. 이 전략은 진입, 포지션 증가, 손절매 및 포지션 관리 등의 핵심 요소를 포함한 완전한 거래 시스템을 설계합니다. 매개변수 최적화와 위험 관리 개선을 통해 이 전략은 실제 거래에서 안정적인 성과를 달성할 것으로 기대됩니다. 실제 거래에 매개변수를 사용하기 전에 거래자는 특정 시장 특성에 따라 매개변수를 완전히 테스트하고 조정하는 것이 좋습니다.
Source
Pine
/*backtest
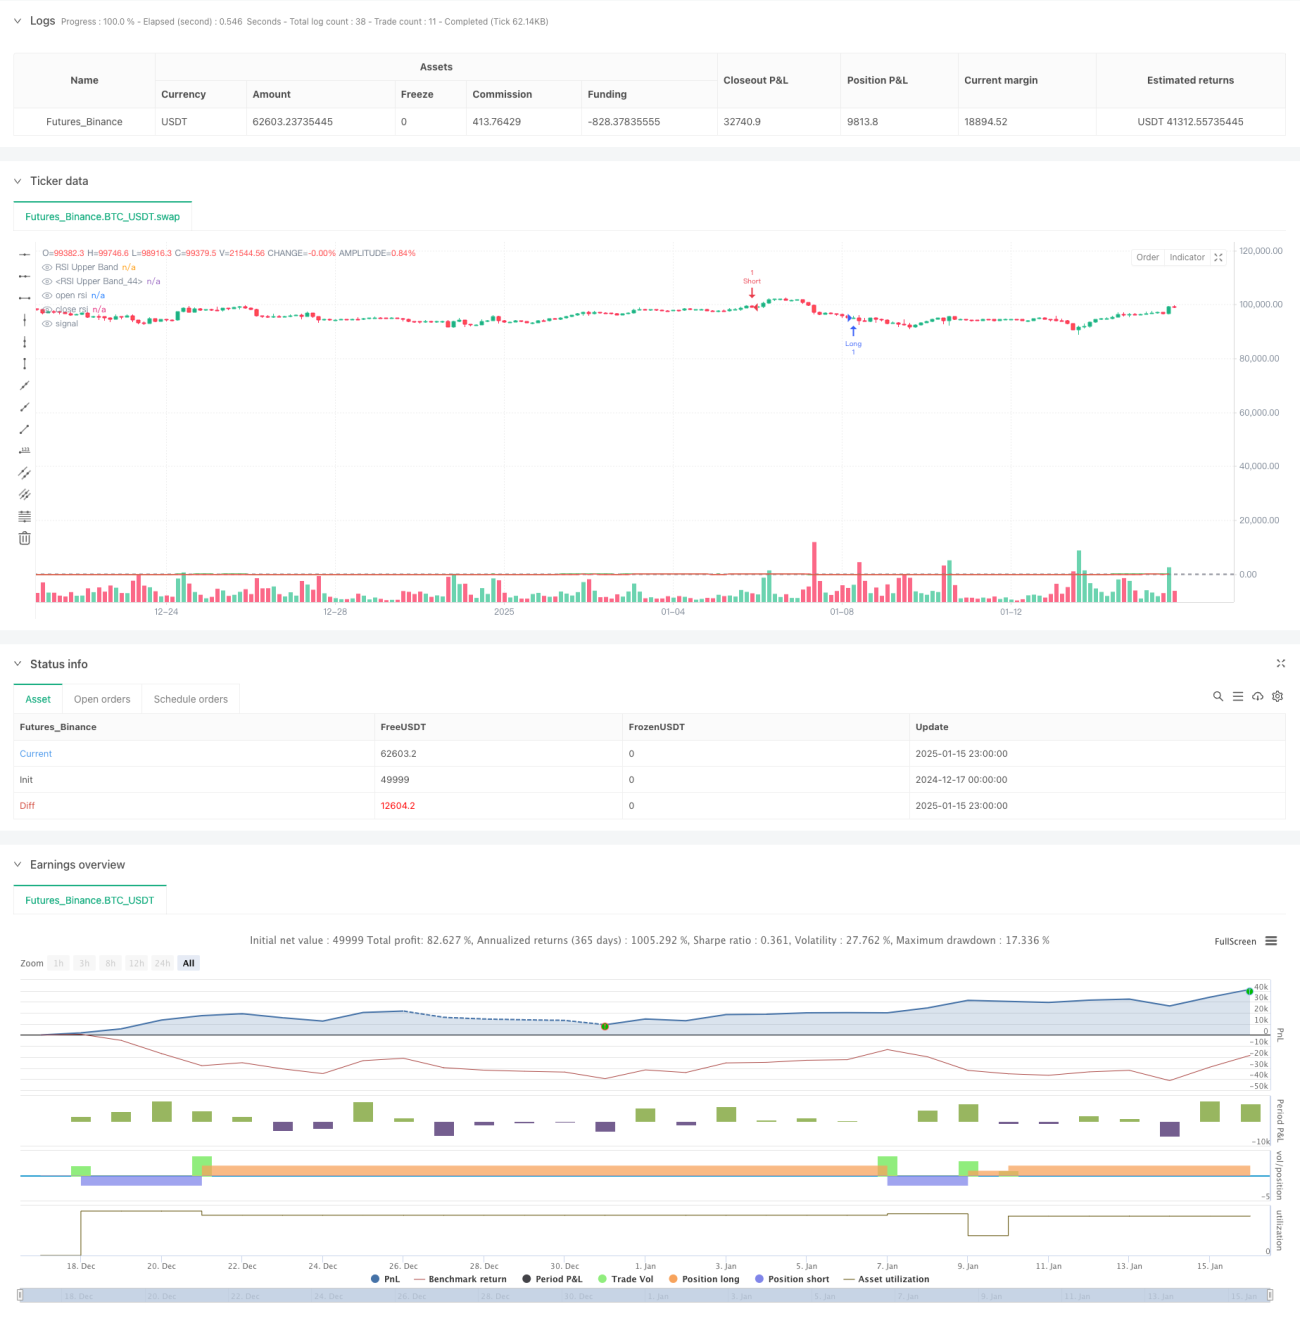
start: 2024-12-17 00:00:00
end: 2025-01-16 00:00:00
period: 3h
basePeriod: 3h
exchanges: [{"eid":"Futures_Binance","currency":"BTC_USDT","balance":49999}]
*/
//@version=5
strategy("RSI Top Strategy", overlay=true, pyramiding=2)
qty1 = input( 1 , "Qty first entry", group="Strategy settings")Strategy parameters
Related strategies
Comment
All comments (0)
No data
- 1