다중 기술 지표 교차 모멘텀 추세 추종 전략

1
Follow
1781
Followers
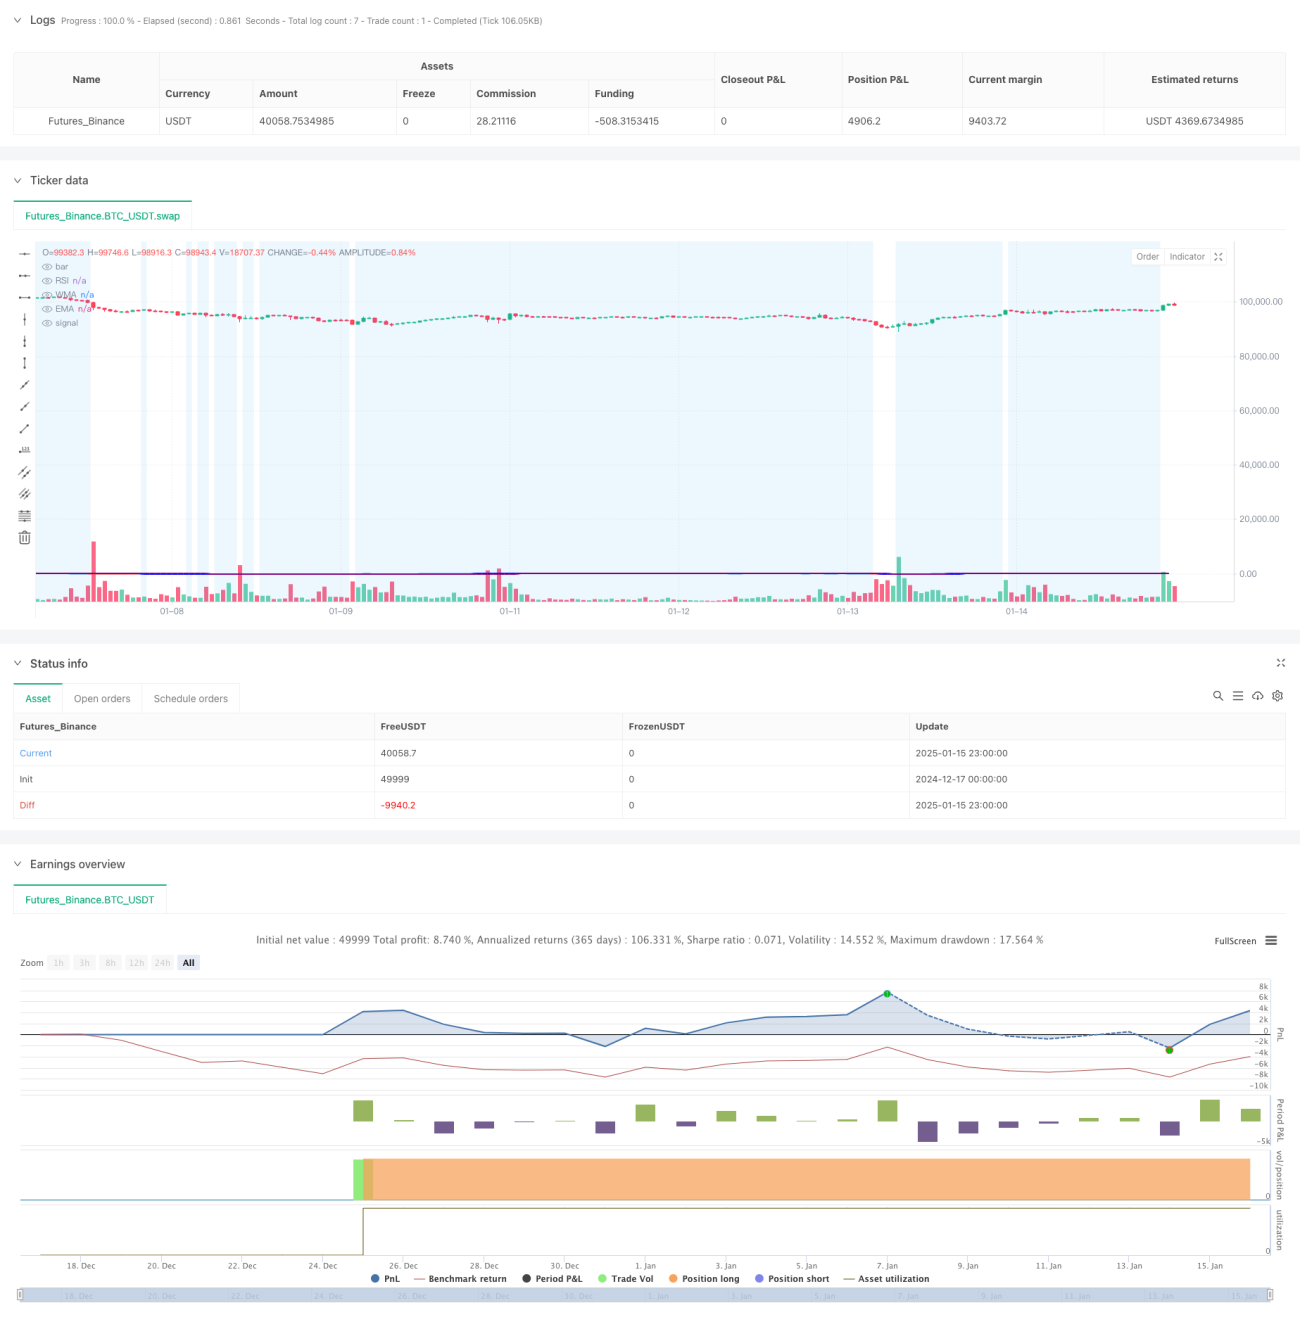
개요
이 전략은 상대 강도 지수(RSI), 가중 이동 평균(WMA), 지수 이동 평균(EMA)을 결합한 추세 추종 거래 시스템입니다. 이 전략은 여러 가지 기술 지표를 조화롭게 활용하여 추세 전환점에서 시장 모멘텀의 변화를 포착하고, 이를 통해 거래 신호를 생성합니다. 이 시스템은 WMA와 EMA의 교차를 활용하여 추세 방향을 확인하고, RSI 지표를 결합하여 시장 상황을 필터링하여 거래의 정확도를 높입니다.
전략 원칙
전략의 핵심 논리는 다음과 같은 핵심 요소에 기초합니다.
- RSI 지표는 14기간을 사용하여 계산되어 시장의 매수 과다 및 매도 과다 조건을 측정합니다.
- 45주기 WMA와 89주기 EMA가 교차하는 시점은 추세 변화를 확인하는 데 사용됩니다.
- 입장 조건:
- 롱 신호: WMA가 EMA 위를 교차하고 RSI가 50 미만
- 단기 신호: WMA가 EMA 아래로 교차하고 RSI>50
- 시스템은 RSI의 색상 변화를 통해 시장 상황을 시각화합니다. RSI>70이면 녹색을 표시하고, <30이면 빨간색을 표시합니다.
- 중립 영역을 식별하는 데 도움이 되도록 RSI 30-70 범위에 파란색 배경이 설정됩니다.
전략적 이점
- 다양한 기술 지표를 결합하면 거래 신호의 신뢰성이 향상됩니다.
- WMA는 최근 가격 변화에 보다 민감하게 반응하는 반면, EMA는 장기적인 추세를 계속 추적합니다.
- RSI는 변동성이 심한 시장에서 거짓 신호를 효과적으로 피하기 위한 필터 역할을 합니다.
- 시각적 인터페이스 디자인은 트레이더가 시장 상황을 직관적으로 판단하는 데 도움이 됩니다.
- 잠재적인 거래 기회를 거래자에게 즉시 알리는 완전한 경고 시스템이 포함되어 있습니다.
전략적 위험
- 횡보 시장에서는 빈번하게 잘못된 돌파 신호가 발생할 수 있습니다.
- 이동평균선의 지연으로 인해 진입 타이밍이 약간 지연될 수 있습니다.
- RSI 임계값에 대한 고정 설정은 모든 시장 환경에 적합하지 않을 수 있습니다.
- 변동성을 고려하지 않으면 변동성이 높은 기간 동안 위험이 증가할 수 있습니다.
- 손절매 및 이익정지 메커니즘 부족으로 펀드 운용 효과에 영향 미칠 수 있어
전략 최적화 방향
- 시장 변동성에 따라 동적으로 조정되는 적응형 RSI 임계값 소개
- ATR 지표를 추가하여 포지션 크기를 제어하고 동적 손절매를 설정합니다.
- WMA 및 EMA 기간 설정을 최적화하고 다른 시간 프레임에 따라 조정하는 것을 고려하세요.
- 볼륨 표시기를 보조 확인 신호로 추가합니다.
- 피라미딩 및 포지션 축소와 같은 보다 복잡한 포지션 관리 시스템을 구현합니다.
요약하다
이는 여러 기술 지표를 기반으로 하는 추세 추적 전략입니다. RSI, WMA, EMA를 조정하여 사용하여 거래 안정성을 보장하면서 시장 추세 전환점을 포착하려고 노력합니다. 특정 히스테리시스 및 거짓 신호 위험이 있기는 하지만, 합리적인 최적화 및 위험 관리 조치를 통해 이 전략은 좋은 실질적 가치와 확장 가능성을 제공합니다.
Source
Pine
Strategy parameters
Related strategies
Comment
All comments (0)
No data
- 1