고급 다중 지표 추세 확인 거래 전략

1
Follow
1781
Followers
개요
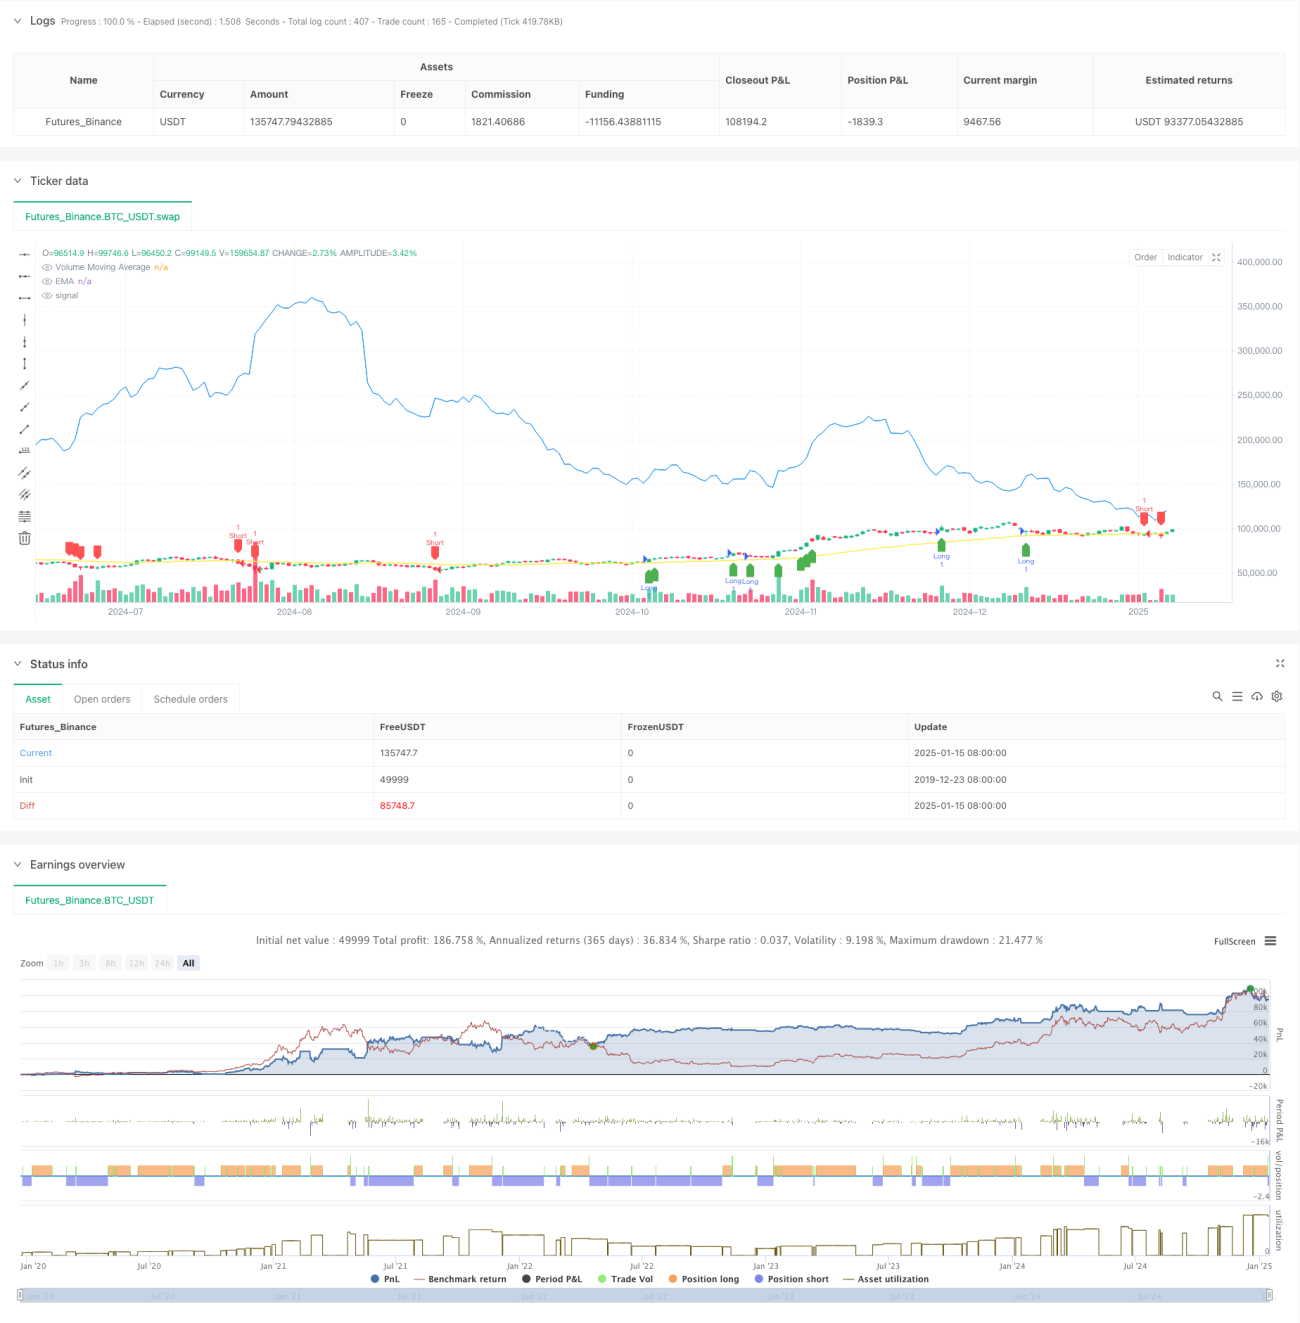
이는 지수 이동 평균(EMA), 거래량 확인, 평균 추세율(ATR) 지표를 결합한 고급 양적 거래 전략입니다. 이 전략은 여러 가지 기술 지표를 사용하여 시장 동향을 정확하게 파악할 뿐만 아니라 볼륨 확인을 통해 거래 신뢰성을 향상시킵니다. 동시에 ATR을 사용하여 손절매 및 이익 실현 포지션을 동적으로 조정하여 포괄적인 위험 관리 시스템을 실현합니다. .
전략 원칙
전략의 핵심 논리는 세 가지 주요 부분으로 구성됩니다.
- 추세 결정: 추세 결정을 위한 주요 지표로 EMA(50)을 사용합니다. 가격이 EMA 위에 있으면 상승 추세로 간주되고, 그렇지 않으면 하락 추세로 간주됩니다.
- 거래량 확인: 20기간 거래량 이동평균(Volume MA)을 계산하면 현재 거래량은 이동평균보다 1.5배 이상이어야 할 뿐만 아니라, 이전 기간의 거래량보다 커야 시장이 충분히 참여하고 있다는 것을 확인할 수 있습니다.
- 위험 관리: 14기간 ATR을 기준으로 손절매 및 이익 실현 포지션을 동적으로 설정합니다. 손절매는 ATR의 2배로 설정되고, 이익 실현은 ATR의 3배로 설정됩니다. 이 설정은 자금의 안전을 보호할 뿐만 아니라 추세가 완전히 발전할 수 있는 여지를 제공합니다.
전략적 이점
- 다중 확인 메커니즘: 추세와 거래량의 이중 확인을 통해 거래 신호의 신뢰성이 크게 향상됩니다.
- 동적 위험 관리: 동적 손절매 및 이익실현 설정에 ATR을 사용하면 시장 변동성 변화에 더 잘 적응할 수 있습니다.
- 강력한 유연성: 전략 매개변수는 다양한 시장 상황에 따라 조정될 수 있으며 적응성이 매우 뛰어납니다.
- 명확한 시각화: 이 전략은 명확한 그래픽 신호 표시를 제공하여 트레이더가 직관적으로 판단할 수 있도록 돕습니다.
전략적 위험
- 추세 반전 위험: 변동성이 큰 시장 상황에서는 EMA가 뒤처져 신호가 지연될 수 있습니다.
- 거래량으로 인한 거짓 돌파: 특정 시장 조건 하에서 높은 거래량은 거짓 돌파의 징후일 수 있습니다.
- 손절매 범위: 어떤 경우에는 2배 ATR의 손절매 설정이 클 수 있으며 조정을 고려해야 할 수도 있습니다.
전략 최적화 방향
- 추세 강도 지표 도입: 추세 판단의 정확도를 더욱 높이기 위해 ADX와 같은 추세 강도 지표를 추가하는 것을 고려하세요.
- 볼륨 필터링 최적화: OBV나 볼륨 가중 이동 평균과 같은 보다 복잡한 볼륨 분석 방법을 도입할 수 있습니다.
- 손절매 메커니즘 개선: 지지선과 저항선에 따라 이동 손절매나 손절매 방법을 추가하는 것을 고려하세요.
- 시간 필터 추가: 시장 활동이 저조한 기간 동안 잘못된 신호를 피하기 위해 거래 기간 필터를 추가했습니다.
요약하다
이 전략은 여러 가지 기술 지표를 종합적으로 활용하여 논리적으로 엄격한 거래 시스템을 구축합니다. 이 전략의 핵심적인 장점은 다중 확인 메커니즘과 역동적인 위험 관리에 있지만, 추세 반전 및 거짓 거래량 돌파와 같은 위험에도 주의를 기울여야 합니다. 지속적인 최적화와 개선을 통해 이 전략은 실제 거래에서 더 나은 성과를 달성할 것으로 기대됩니다.
Source
Pine
Strategy parameters
Related strategies
Comment
All comments (0)
No data
- 1