
1
Follow
1781
Followers
개요
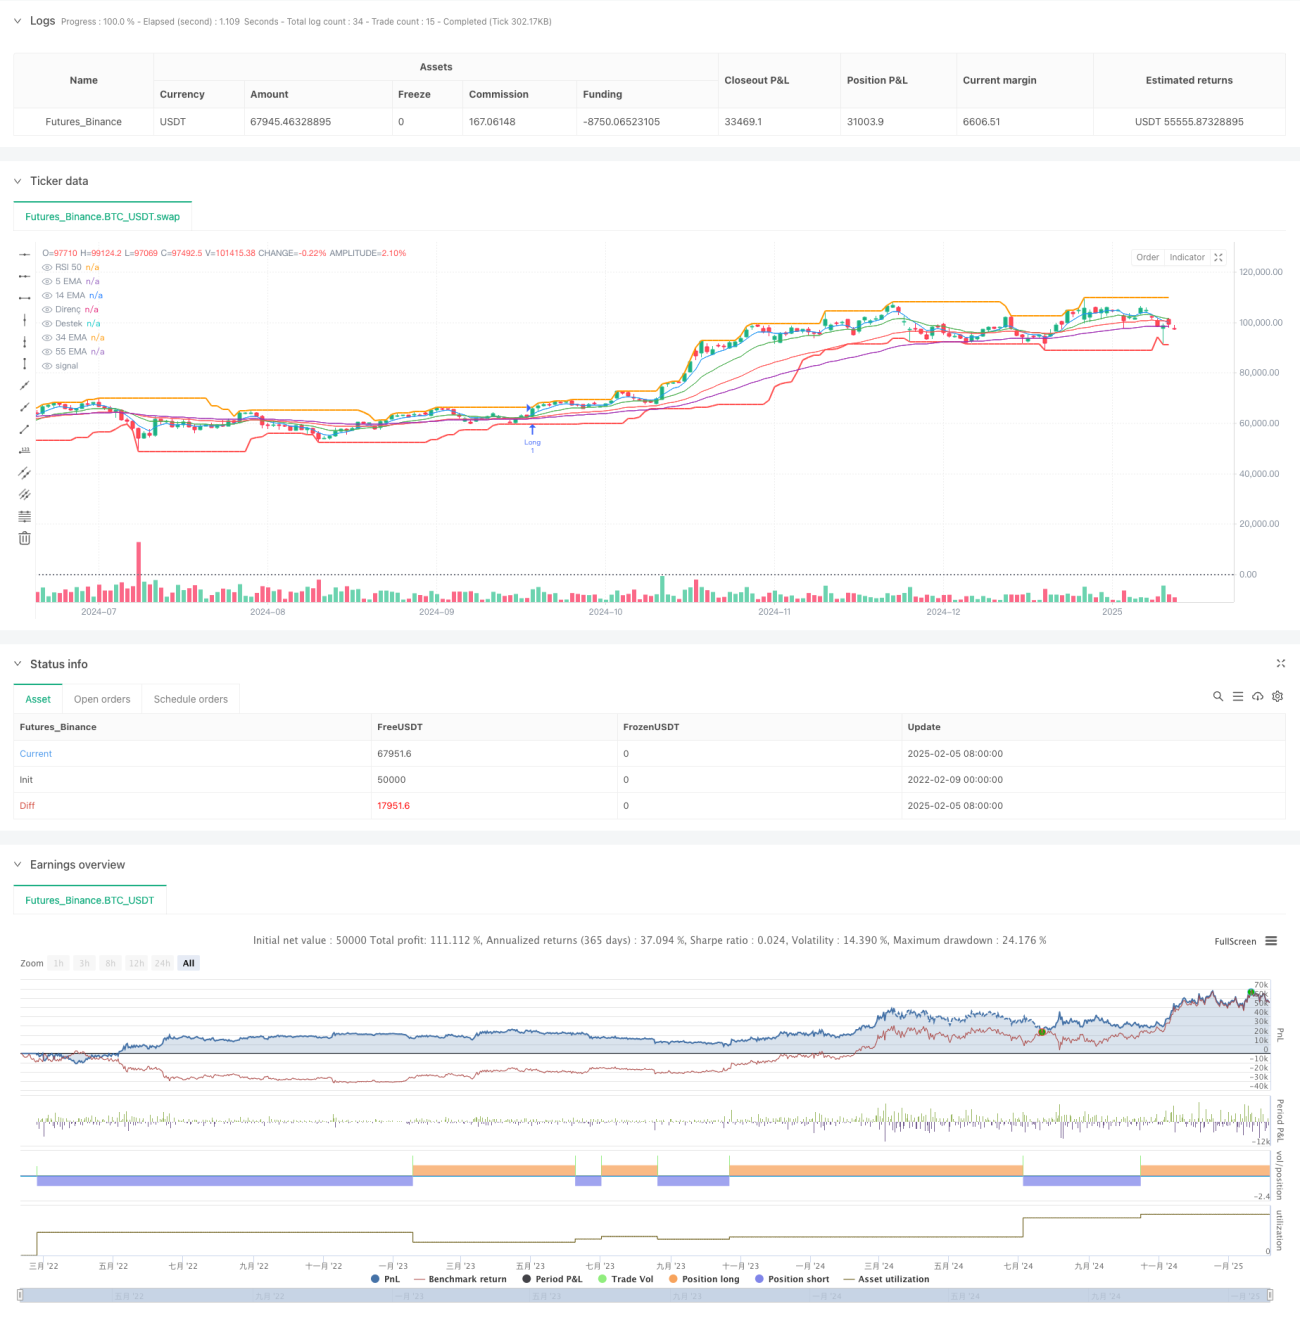
이 전략은 단기, 중기 및 장기 이동 평균 사이의 관계를 분석하여 운동량 지표와 거래량 확인을 결합하여 시장 추세가 명확한 경우에 거래를 수행합니다. 이 시스템은 또한 지지점 및 저항점 분석을 도입하여 거래의 정확성을 더욱 향상시킵니다.
전략 원칙
이 전략은 다음과 같은 핵심 요소들에 기반합니다.
- 다중 EMA 시스템: 5, 14, 34, 55 주기 EMA를 사용하여 평균선의 배열을 통해 트렌드 방향을 확인한다. 짧은 주기 평균선이 긴 주기 평균선 위에 있을 때 상승 트렌드로 간주하고, 반대로 하향 트렌드로 간주한다.
- MACD 지표: 시장 동력을 확인하기 위해 쓰인다. MACD 기둥 그래프가 긍정적이면 상승 동력이 강한 것을 나타내고, 부정적이면 하향 동력이 강한 것을 나타낸다.
- RSI 지표: 시장의 강점과 약점을 확인하는 지표로서. RSI 50 이상은 시장이 강점 영역에 있음을 나타내고, 50 미만으로 시장이 약점 영역에 있음을 나타냅니다.
- 거래량 분석: 거래량이 20주기 거래량 평균의 1.5배 이상으로 시장에 충분한 거래 활동이 있는지 확인합니다.
- 지원 저항 지점: 20주기의 최고 가격과 최저 가격을 계산하여 단기 지원 저항 지점을 결정한다.
전략적 이점
- 다차원 분석: 여러 기술 지표를 결합하여 잘못된 신호의 위험을 줄입니다.
- 트렌드 확인: 다중 평균선 시스템을 사용하여 시장 추세를 더 정확하게 판단할 수 있습니다.
- 동력 검증: MACD와 RSI의 조합을 통해 트렌드를 확인하면서도 추세를 쫓는 것을 피한다.
- 양과 가격 결합: 거래 수를 거래 확인의 필수 조건으로 삼아 거래의 신뢰성을 높인다.
- 위험 제어: 지지 저항 지점의 분석을 통해 손해 막을 위한 참고 자료를 제공한다.
전략적 위험
- 흔들림 시장 위험: 가로판 흔들림 시장에서 빈번한 잘못된 신호가 발생할 수 있다.
- 뒤떨어진 위험: 여러 개의 이동 평균을 사용했기 때문에 전략에는 약간의 뒤떨어진 점이 있습니다.
- 비용 위험: 자주 거래하면 거래 비용이 더 높을 수 있습니다.
- 시장 환경 의존성: 전략은 강한 추세 시장에서 잘 작동하지만 다른 시장 환경에서는 좋지 않을 수 있습니다.
전략 최적화 방향
- 매개 변수 최적화: 역사 데이터를 통해 각 지표의 주기 매개 변수를 최적화할 수 있다.
- 스톱 로드 최적화: 트래킹 스톱 또는 ATR 기반의 스톱 로드와 같은 동적 스톱 메커니즘을 추가합니다.
- 시장 환경 분류: 시장 환경 판단 모듈을 추가하고, 다른 시장 환경에서 다른 거래 매개 변수를 사용합니다.
- 신호 필터: 트렌드 강도 필터를 추가하여 약한 트렌드 환경에서 거래하는 것을 피하십시오.
- 포지션 관리: 동적 포지션 관리 메커니즘을 도입하여 신호 강도에 따라 포지션 보유 비율을 조정한다.
요약하다
이 전략은 종합적인 트렌드 추적 시스템으로, 다수의 기술적 지표의 조화를 통해 거래의 신뢰성을 보장하면서도 어느 정도의 위험 제어 능력을 갖추고 있다. 전략의 핵심 장점은 다차원적인 분석 방법이지만, 동시에 전략의 성능에 대한 시장 환경의 영향을 주의해야 한다. 지속적인 최적화와 개선으로, 이 전략은 실제 거래에서 더 나은 성능을 기대한다.
Source
Pine
Strategy parameters
Related strategies
Comment
All comments (0)
No data
- 1