
1
Follow
1781
Followers
개요
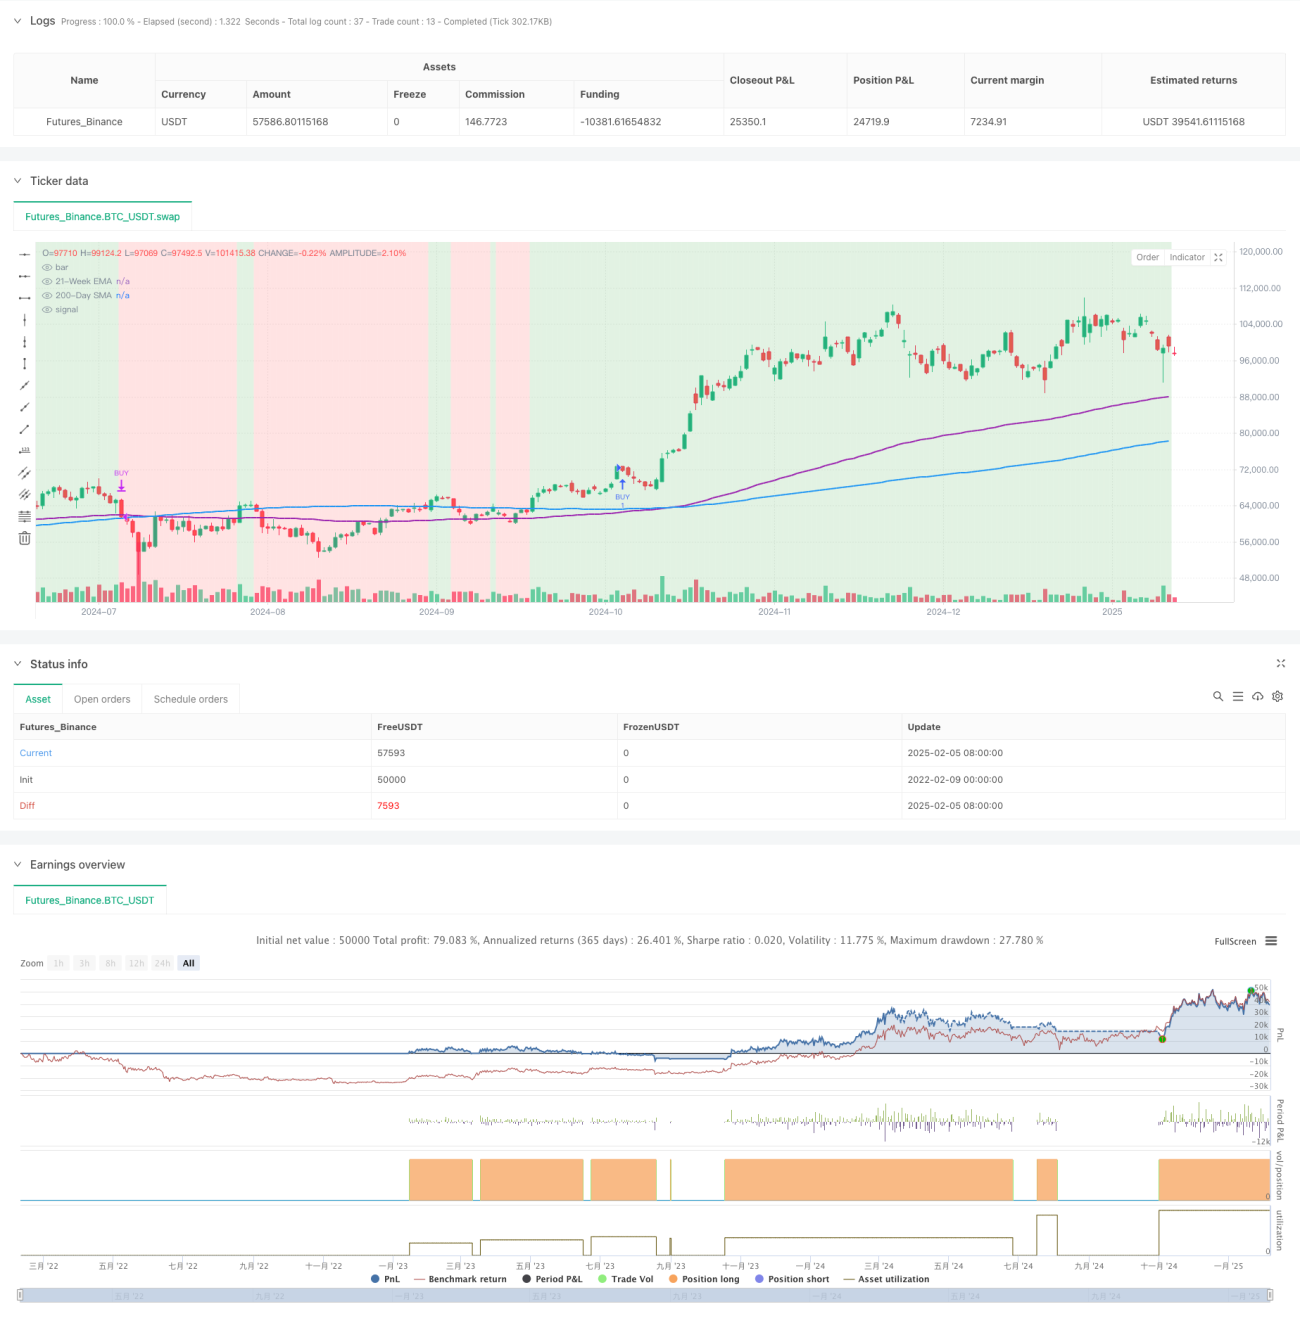
이 전략은 기술 분석에 기반한 동적 트렌드 추적 시스템으로, 시장 트렌드를 식별하기 위해 주로 쌍평균선을 사용한다. 전략은 상대적으로 약한 지표 (RSI) 와 평균 트렌드 지표 (ADX) 를 동적 필터로 통합하고 실제 파도 (ATR) 와 결합하여 동적 위험 관리를 수행하여 상승 추세를 정확하게 포착하고 위험을 효과적으로 제어한다.
전략 원칙
전략의 핵심 논리는 다음과 같은 핵심 요소에 기초합니다.
- 200일 간소 이동 평균 (SMA) 과 21주 지수 이동 평균 (EMA) 의 이중 확인을 사용하여 다면 시장 조건을 정의합니다.
- RSI>50 조건으로 동력이 지속적으로 상승하도록 보장합니다.
- ADX>25의 조건으로 트렌드 강도를 검증합니다.
- ATR 기반의 다이내믹 스톱 로즈 설정으로 시장의 변동에 대응하는 리스크 제어를 제공합니다.
- 수익을 달성할 때 수익을 달성할 수 있도록 백분율 제약을 적용합니다
전략적 이점
- 시스템은 시장의 변동에 따라 스톱 포지션을 조정할 수 있는 좋은 적응력을 가지고 있습니다.
- 쌍평선 교차는 신뢰할 수 있는 트렌드 확인 신호를 제공하여 가짜 돌파의 위험을 효과적으로 감소시킵니다.
- RSI와 ADX의 조합으로 출장 신호의 품질이 크게 향상되었습니다.
- 다양한 시장 환경에 따라 최적화 할 수있는 전략 매개 변수가 고도로 사용자 정의
- 일선 수준의 거래로 거래 비용과 단기 변동의 영향을 줄입니다.
전략적 위험
- 변동성이 큰 시장에서는 빈번한 거짓 신호가 생성되어 거래 비용이 증가할 수 있습니다.
- 평균선 전략은 자연적으로 지연성이 있으며, 트렌드 초반의 일부 수익을 놓칠 수 있습니다.
- 여러 필터링 조건으로 인해 잠재적인 거래 기회를 놓칠 수 있습니다.
- 급격한 변동이 있는 시장에서 ATR 기반의 단축은 너무 느슨할 수 있습니다.
- 고정 비율이 강세에서 너무 일찍 마감될 수 있습니다.
전략 최적화 방향
- 신호 신뢰성을 높이기 위해 보조 확인으로 통행량 지표를 도입할 수 있다.
- 시장의 다른 단계에 더 잘 적응할 수 있도록 동적 제동 장치를 추가하는 것을 고려하십시오.
- RSI 및 ADX의 파라미터 설정을 최적화하여 신호의 <unk>성을 향상시킵니다.
- 트렌드 강도의 계층 판단, 포지션의 동적 관리
- 시장의 변동성 지표를 도입하여 높은 변동성 기간 동안 거래 빈도를 적절하게 조정합니다.
요약하다
이것은 합리적이고 논리적으로 명확하게 설계된 트렌드 추적 전략이며, 여러 가지 기술 지표를 조합하여 수익과 위험을 더 잘 균형 잡는다. 전략은 사용자 정의가 강하며, 다양한 시장 환경에서 매개 변수를 최적화하여 유효성을 유지하는 데 적합하다. 약간의 후기 위험이 있지만, 개선된 위험 제어 장치로 전략 전체는 더 나은 안정성과 신뢰성을 보여준다.
Source
Pine
/*backtest
start: 2022-02-09 00:00:00
end: 2025-02-06 08:00:00
period: 1d
basePeriod: 1d
exchanges: [{"eid":"Futures_Binance","currency":"BTC_USDT"}]
*/

//@version=6
strategy("BTCUSDT Daily - Enhanced Bitcoin Bull Market Support [CYRANO]", shorttitle="BTCUSDT Daily BULL MARKET", overlay=true, commission_type=strategy.commission.percent, commission_value=0.1, slippage=3)

// InputsStrategy parameters
Related strategies
Comment
All comments (0)
No data
- 1