RSI와 볼륨 확인 시스템과 결합된 3개 이동 평균 교차 추세 추종 전략

1
Follow
1781
Followers
개요
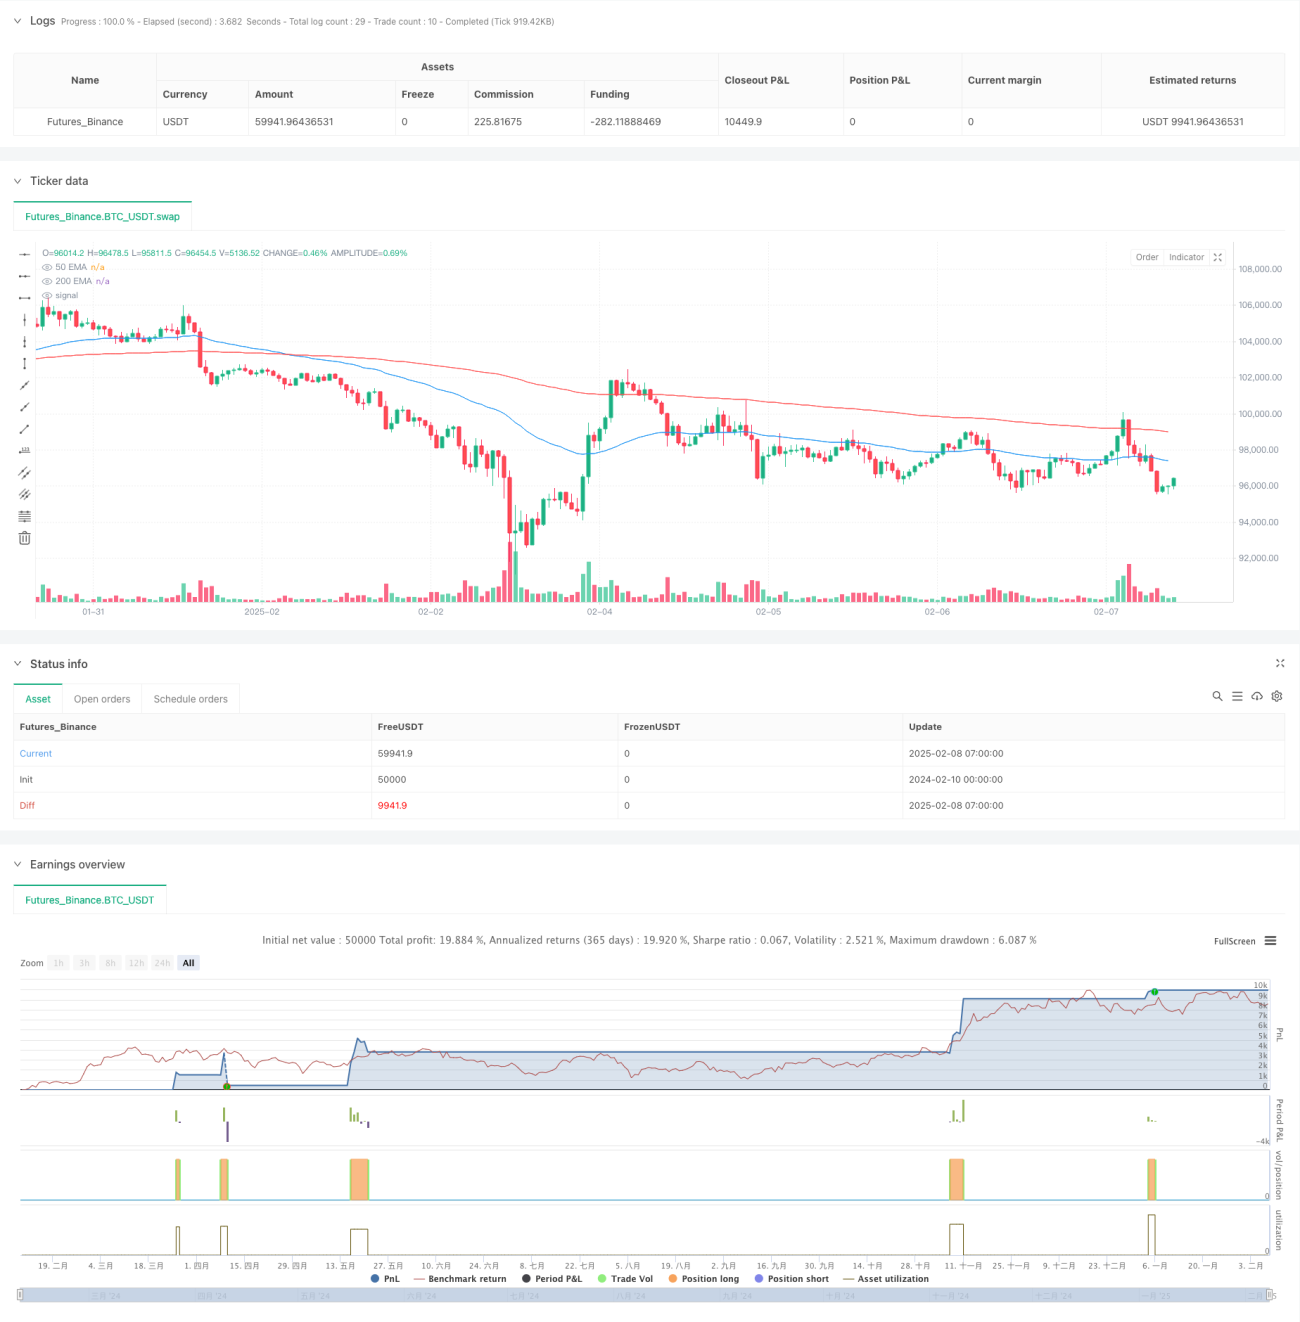
이 전략은 다중 기술 지표에 기반한 트렌드 추적 거래 시스템으로, 평평선 교차, 동력 지표, 거래량 확인의 3 차원을 결합하여 높은 확률의 거래 기회를 식별합니다. 합리적인 중지 손실 및 수익 목표를 설정하여, 이 전략은 위험을 제어하면서 높은 수익률을 추구합니다. 이 전략은 주로 더 큰 시간 주기 트렌드 거래에 적합하며, 암호화폐, 외환 및 주식 등 여러 시장에 적용됩니다.
전략 원칙
전략의 핵심 논리는 다음과 같은 핵심 요소에 기초합니다.
- 50일 및 200일 두 개의 지수 이동 평균 ((EMA) 을 사용하여 트렌드 방향을 판단하기 위해, 단기 평균선이 장기 평균선을 상향으로 가로질러 다중 신호를 생성하고, 반대로 하위 신호를 생성한다.
- 상대적으로 강하고 약한 지수 ((RSI) 를 도입하여 동력을 확인합니다. RSI가 50보다 크면 상승 동력으로 간주되며, 50보다 작으면 하락 동력으로 간주됩니다.
- 거래 신호의 유효성을 확인하기 위해 현재 거래량과 20일 평균의 1.5배를 비교하여 거래량이 증가할 때 거래하는 것을 보장합니다.
- 14일 실제 파도 ((ATR) 동적 설정 스톱 로지 기반, 스톱 로지는 최근 하위점 아래 1.5배의 ATR에 위치한다.
- 3배의 위험 척도를 사용하여 수익 목표를 설정합니다. 즉, 목표 수익은 3배의 손실 금액입니다.
전략적 이점
- 다중 신호 확인 메커니즘은 거래의 정확성을 크게 향상시키고, 단일 지표로 인해 발생할 수 있는 잘못된 신호를 방지한다.
- 동적 스톱로스 설정은 시장의 변동성에 적응하여 더 나은 위험 보호를 제공합니다.
- 3:1의 수익 위험 비율이 설정되어 있어 전략은 승률이 높지 않더라도 수익을 유지할 수 있다.
- 전략은 더 큰 시간 주기를 통해 실행되며, 단기 시장 소음을 필터링하여 주요 트렌드를 포착할 수 있습니다.
- 좋은 시장 적응력을 가지고 있으며, 다양한 유형의 거래 품종에 적용할 수 있다.
전략적 위험
- 가로 디스크 정리 시장에서 종종 가짜 브레이크 신호가 발생하여 연속적인 스톱 손실이 발생할 수 있습니다.
- 엄격한 신호 확인 메커니즘으로 인해 잠재적인 거래 기회가 놓쳐질 수 있습니다.
- 고정된 3배의 수익 위험 비율은 특정 시장 조건에서 너무 이상적일 수 있습니다.
- 거래량 지표에 의존하는 것은 특정 시장 (예를 들어, 암호화폐) 에서 시장 조작의 영향을 받을 수 있다.
전략 최적화 방향
- 적응형 평균주기를 도입하여 전략이 다른 시장주기에 더 잘 적응할 수 있다.
- 트렌드 강도 지표를 추가하는 것을 고려하고, 강한 트렌드에서 보다 적극적인 포지션 관리를 적용한다.
- 시장의 변동성에 따라 조정되는 역동적인 수익 위험 비율 설정 메커니즘을 개발하십시오.
- 시장 상태 인식 모듈을 추가하여 다른 시장 상태에서 다른 파라미터 설정을 사용합니다.
- 거래량을 확인하는 <unk>값을 계산하는 방법을 최적화하여 더 적응할 수 있도록 한다.
요약하다
이 전략은 평행선 교차, RSI 동력 및 거래량 삼중 확인 메커니즘을 통해 안정적인 트렌드 추적 시스템을 구축한다. 3 배의 수익 위험 비율이 전략에 좋은 수익 공간을 제공하며, ATR 기반의 동적 중단 메커니즘은 필요한 위험 보호를 제공합니다. 전략은 가로 시장에서 부실하게 수행 할 수 있지만, 제안된 최적화 방향으로 전략의 적응성과 안정성을 더욱 향상시킬 수 있다.
Source
Pine
Strategy parameters
Related strategies
Comment
All comments (0)
No data
- 1