
1
Follow
1781
Followers
개요
이것은 다중 기술 지표와 위험 관리에 기반한 트렌드 추적 전략이다. 이 전략은 이동 평균, 상대적으로 강한 지표 ((RSI), 운동 지표 ((DMI) 와 같은 여러 기술 지표를 통합적으로 사용하여 시장 추세를 식별하고, 동적 손실, 위치 관리 및 월 최대 인출 제한과 같은 위험 제어 수단으로 자금을 보호한다. 이 전략의 핵심은 다차원 기술 지표를 통해 트렌드의 유효성을 확인하는 것과 동시에 위험을 엄격히 통제하는 것이다.
전략 원칙
이 전략은 여러 계층의 트렌드 확인 메커니즘을 사용합니다.
- 8/21/50 주기 지수 이동 평균 (EMA) 을 통해 트렌드 방향을 판단
- 트렌드 필터로 가격 채널 중선을 사용함
- RSI 평균선 ((5주기) 과 결합하여 35-65 범위의 움직임을 필터링하여 가짜 브레이크를 처리합니다.
- DMI 지표 ((14주기) 를 통해 트렌드 강도를 확인
- 동력 지표 ((8주기) 와 교류량을 확대하여 트렌드의 지속성을 검증
- ATR 기반의 동적 상쇄를 사용하여 위험을 제어합니다.
- 고정 리스크 모드를 적용한 포지션 관리, 각 거래의 리스크 범위는 초기 자본의 5%
- 과도한 손실을 방지하기 위해 월 최대 인출 제한을 10%로 설정합니다.
전략적 이점
- 트렌드 판단의 정확성을 높이는 다중 기술 지표의 크로스 검증
- 다이내믹 스톱 메커니즘은 단일 거래 위험을 효과적으로 제어합니다.
- 고정된 리스크의 포지션 관리 방식은 자금을 보다 합리적으로 사용하도록 합니다.
- 월 최대 인출 제한은 체계적인 위험 방어를 제공합니다.
- 트렌드 확인의 신뢰성을 강화하기 위한 합성 거래량 지표
- 2:1의 이익/손실 비율이 장기적인 수익성을 높여줍니다.
전략적 위험
- 다중 지표의 사용은 신호 지연을 초래할 수 있습니다.
- 불안한 시장에서 빈번한 잘못된 신호가 발생할 수 있습니다.
- 고정 위험 모형은 급격한 변동에 대해 유연하지 않을 수 있습니다.
- 월간 인출 제한으로 인해 중요한 거래 기회를 놓칠 수 있습니다.
- 트렌드가 반전될 경우 더 큰 반전을 겪을 수 있다.
전략 최적화 방향
- 다양한 시장 환경에 맞게 적응 가능한 지표 매개 변수를 도입합니다.
- 시장의 변동성을 고려하여 더 유연한 포지션 관리 프로그램을 개발
- 트렌드 강도를 평가하고, 진입 시기를 최적화합니다.
- 더 똑똑한 월간 리스크 제한 장치를 설계합니다.
- 시장 환경 인식 모듈을 추가하여 다른 시장 조건에 따라 전략 매개 변수를 조정합니다.
요약하다
이 전략은 다차원 기술 지표의 통합적인 사용을 통해 비교적 완전한 트렌드 추적 거래 시스템을 구축한다. 전략의 장점은 역동적 인 손실, 위치 관리 및 철회 제어를 포함한 포괄적 인 위험 관리 프레임 워크에 있다. 약간의 뒤처짐 위험이 있지만, 최적화 및 개선으로 전략은 다양한 시장 환경에서 안정적인 성능을 유지할 것으로 예상된다. 핵심은 전략의 핵심 논리를 유지하면서 시장 환경에 대한 적응력을 강화하는 것입니다.
Source
Pine
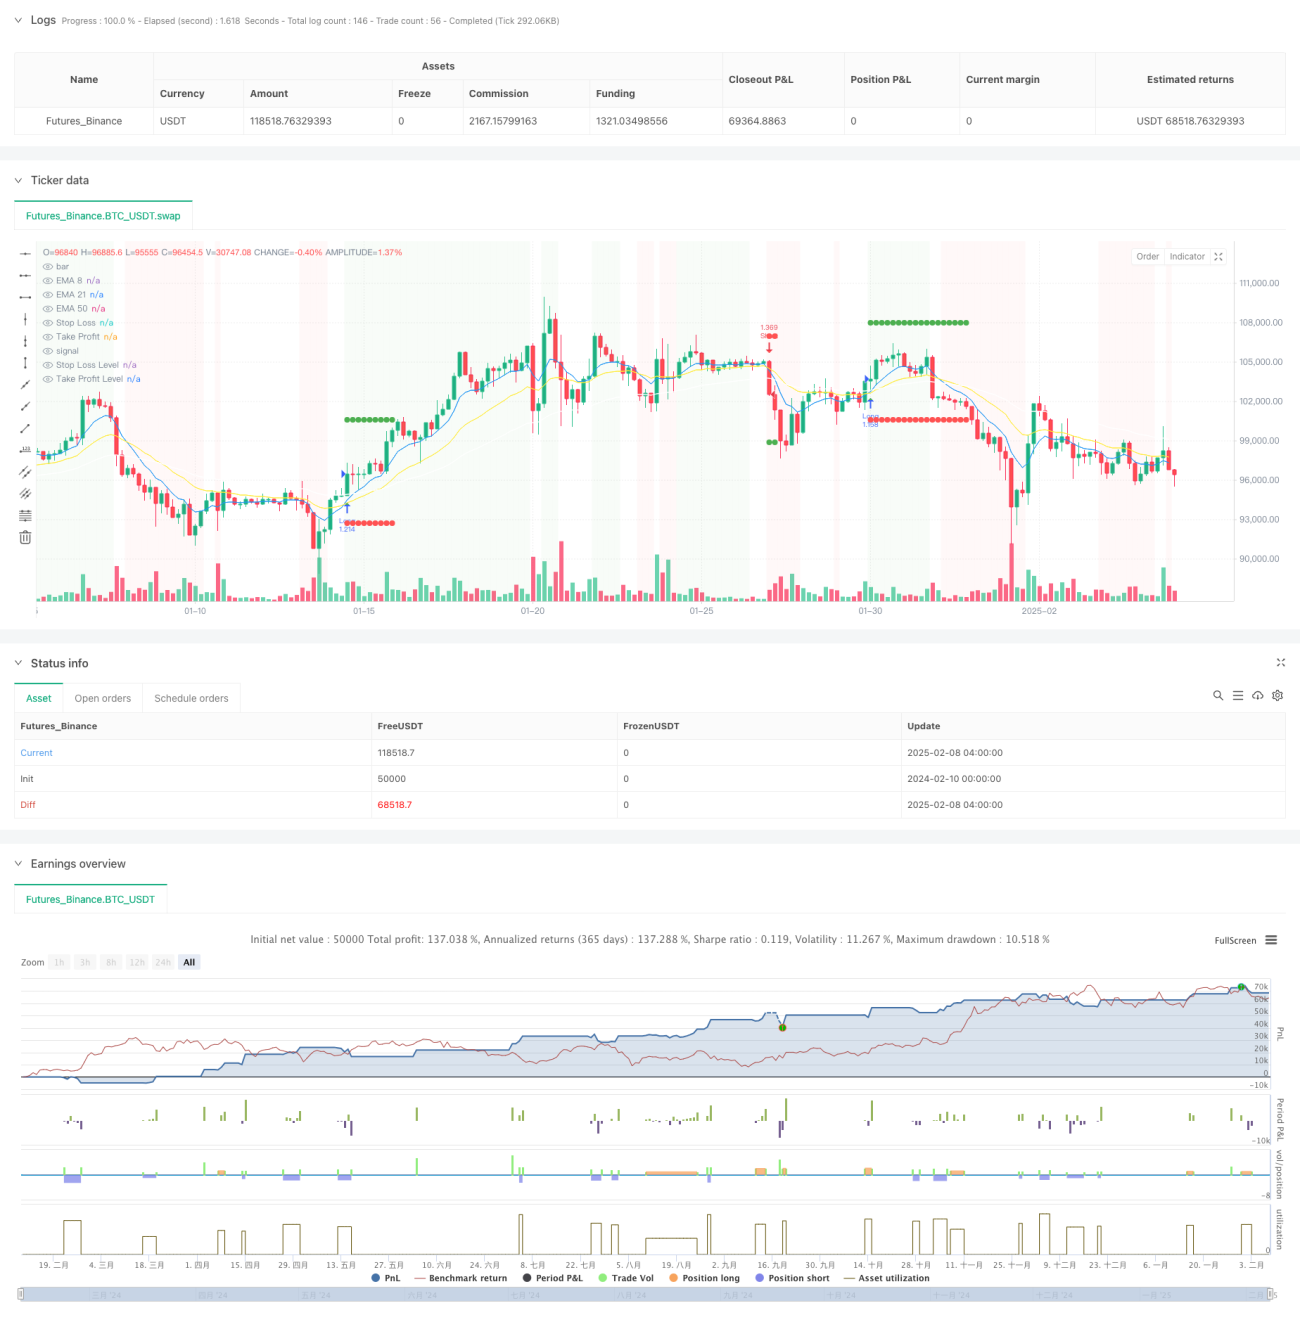
/*backtest
start: 2024-02-10 00:00:00
end: 2025-02-08 08:00:00
period: 4h
basePeriod: 4h
exchanges: [{"eid":"Futures_Binance","currency":"BTC_USDT"}]
*/

//@version=5
strategy("High Win-Rate Crypto Strategy with Drawdown Limit", overlay=true, initial_capital=10000, default_qty_type=strategy.fixed, process_orders_on_close=true)

// Moving AveragesComment
All comments (0)
No data
- 1