SuperTrend 기반 다중 지표 트렌드 모멘텀 거래 전략

1
Follow
1781
Followers
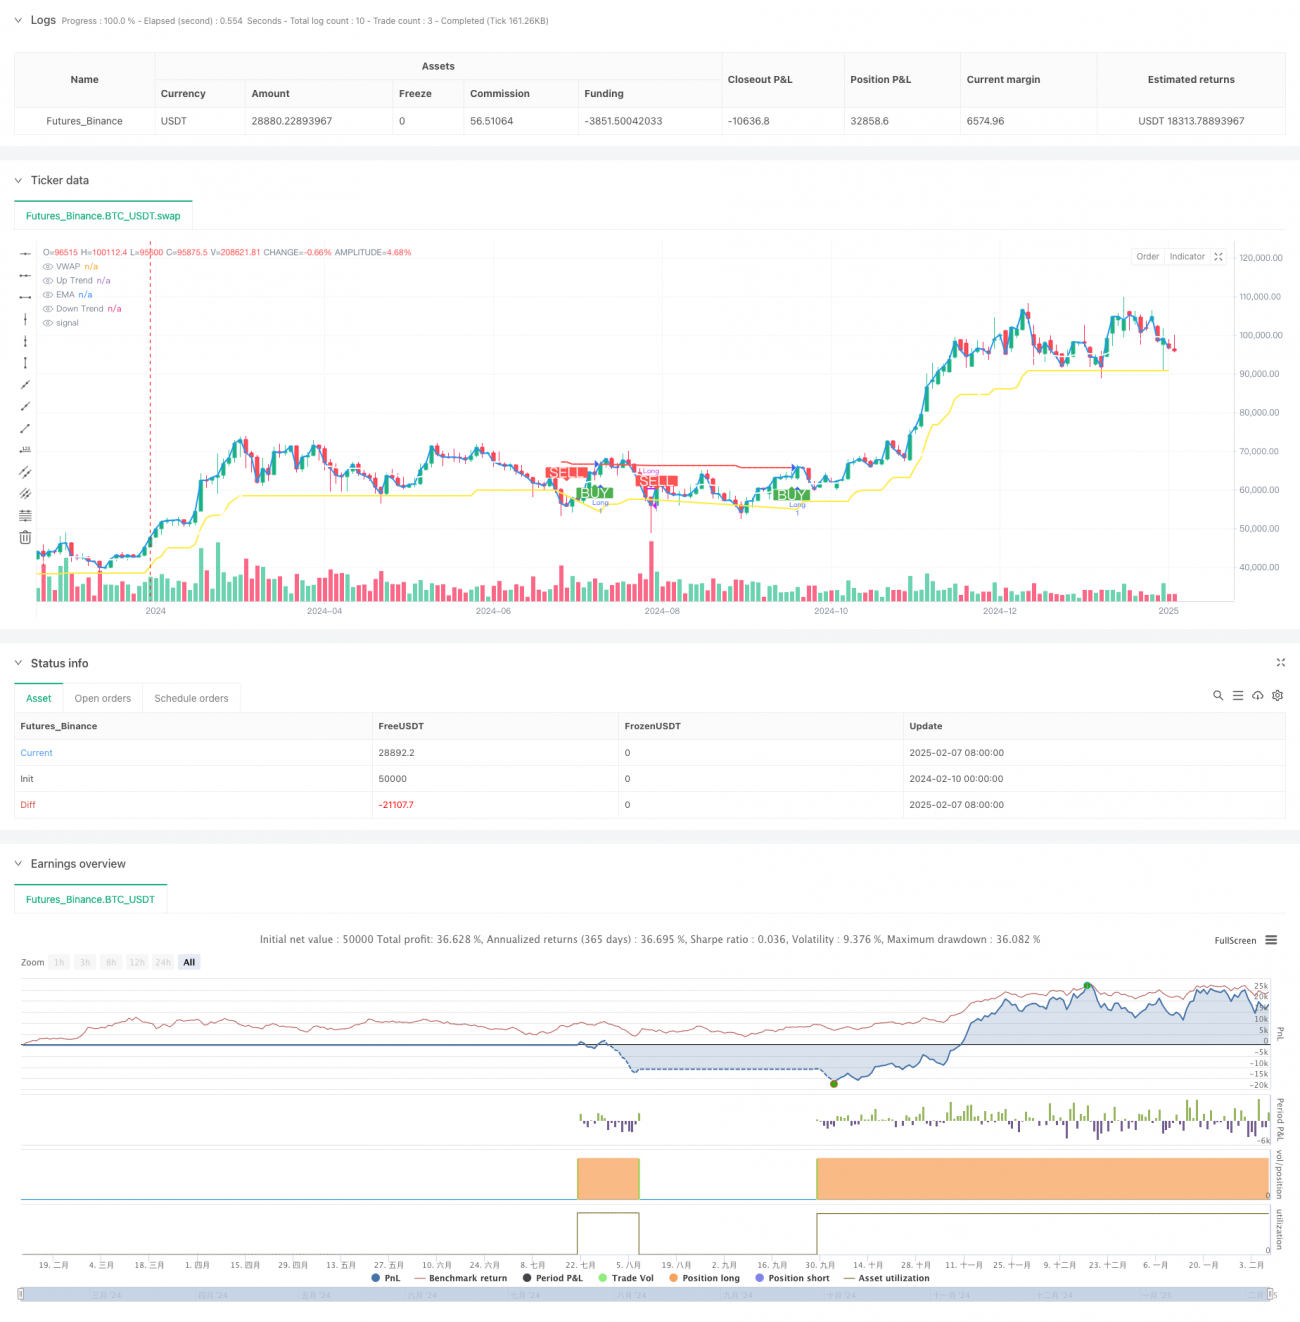
개요
이것은 SuperTrend, VWAP, EMA, 그리고 ADX의 여러 기술 지표를 결합한 트렌드 추적 거래 전략이다. 이 전략은 주로 SuperTrend 지표를 통해 트렌드 방향을 식별하고 VWAP와 EMA의 위치 관계를 사용하여 트렌드를 확인하며, ADX 지표를 사용하여 약한 트렌드를 필터링하여 높은 정확도 거래 신호를 제공합니다. 전략 설계는 낮 거래, 특히 5 분, 15 분, 1 시간 등의 시간에 적합하다.
전략 원칙
이 전략의 핵심 논리는 다음과 같은 몇 가지 핵심 요소에 기반합니다.
- 슈퍼트렌드 지표는 10주기의 ATR과 3.0의 배수를 사용하여 추세 방향을 결정합니다. 가격이 상향 궤도를 돌파 할 때 다중 트렌드가 형성되며 (녹색), 하향 궤도를 돌파 할 때 공허 트렌드가 형성됩니다 (붉은).
- 21주기 EMA는 동적인 지원/저항 지점으로 사용되며, VWAP와 함께 트렌드를 확인한다. VWAP가 EMA 위에 있을 때, 다중 머리 편향이 있다. 반대로 공허 머리 편향이 있다.
- ADX 지표는 트렌드 강도를 측정하기 위해 사용되며, ADX 값이 25보다 크면 트렌드가 강하다는 것을 나타내고 거래 신호는 더 신뢰할 수 있습니다. 25보다 낮으면 트렌드가 약하다는 것을 나타내고 신중해야합니다.
- 참가 조건은 다음과 같습니다.
구매 신호: 슈퍼 트렌드가 초록색으로 바뀌었다 (상향 추세가 확인되었다), VWAP와 EMA의 상위에서 마감, ADX는 추세 강도를 나타냈다.
판매 신호: 슈퍼 트렌드가 빨간색으로 바뀌었다 (하향 추세 확인), VWAP와 EMA 아래의 종결 가격, ADX 하향 추세 강도를 확인했다.
전략적 이점
- 다중 지표 크로스 검증은 거래 신호의 정확성을 높여서 가짜 브레이크를 효과적으로 줄여줍니다.
- ADX 지표의 필터링을 통해 약한 트렌드 현상, 거래 성공률을 높였다.
- 전략은 명확한 구매/판매 신호를 제공하며, 트렌드 배경 색상으로 표시되어 거래 실행을 용이하게 합니다.
- 매개 변수는 다른 시장과 거래 품종에 따라 유연하게 조정할 수 있으며, 적응력이 강하다.
- 트렌드 추적과 동력 거래의 장점을 결합하여 강력한 트렌드 상황에서 더 나은 수익을 얻을 수 있습니다.
전략적 위험
- 불안한 시장에서 빈번하게 잘못된 신호가 발생하여 지속적인 손실이 발생할 수 있습니다.
- 여러 지표의 사용은 신호 지연을 유발할 수 있으며, 출입 시간에도 영향을 미칠 수 있다.
- ATR 변수의 설정은 정책 성능에 큰 영향을 미치며, 부적절한 변수는 과도한 파동 또는 신호 부족으로 이어질 수 있다.
- 급격한 역전 상황에서 전략적 대응이 적당히 이루어지지 않아 철수할 수 있다.
전략 최적화 방향
- 거래량 지표를 도입하여 거래량으로 가격 돌파의 유효성을 확인 할 수 있습니다.
- 자금 관리 능력을 향상시키기 위해 Stop Loss Stop 기능을 추가하는 것을 고려하십시오.
- 시장의 변동에 따라 ATR 및 ADX의 파라미터를 자동으로 조정하는 적응 파라미터 메커니즘을 개발하십시오.
- 시장 환경 인식 기능이 추가되어 불안한 시장에서 자동으로 포지션을 줄이거나 거래를 중지합니다.
- 더 많은 시장 구조 분석 도구를 도입하여 거래의 정확성을 향상시킵니다.
요약하다
이것은 구조적으로 완전하고 논리적으로 명확한 트렌드 추적 전략이다. 다중 지표의 조합 사용으로 거래 신호의 신뢰성을 효과적으로 향상시킨다. 전략의 장점은 신호가 명확하고 실행하기 쉽고, 동시에 좋은 확장성이 있다는 것이다. 그러나 실제 응용에서는 시장 환경에 대한 선택에 주의를 기울이고, 위험을 잘 통제해야 한다. 지속적인 최적화 및 개선으로, 이 전략은 트렌드성이 강한 시장에서 안정적인 수익을 얻을 수 있다.
Source
Pine
Strategy parameters
Related strategies
Comment
All comments (0)
No data
- 1