
1
Follow
1781
Followers
개요
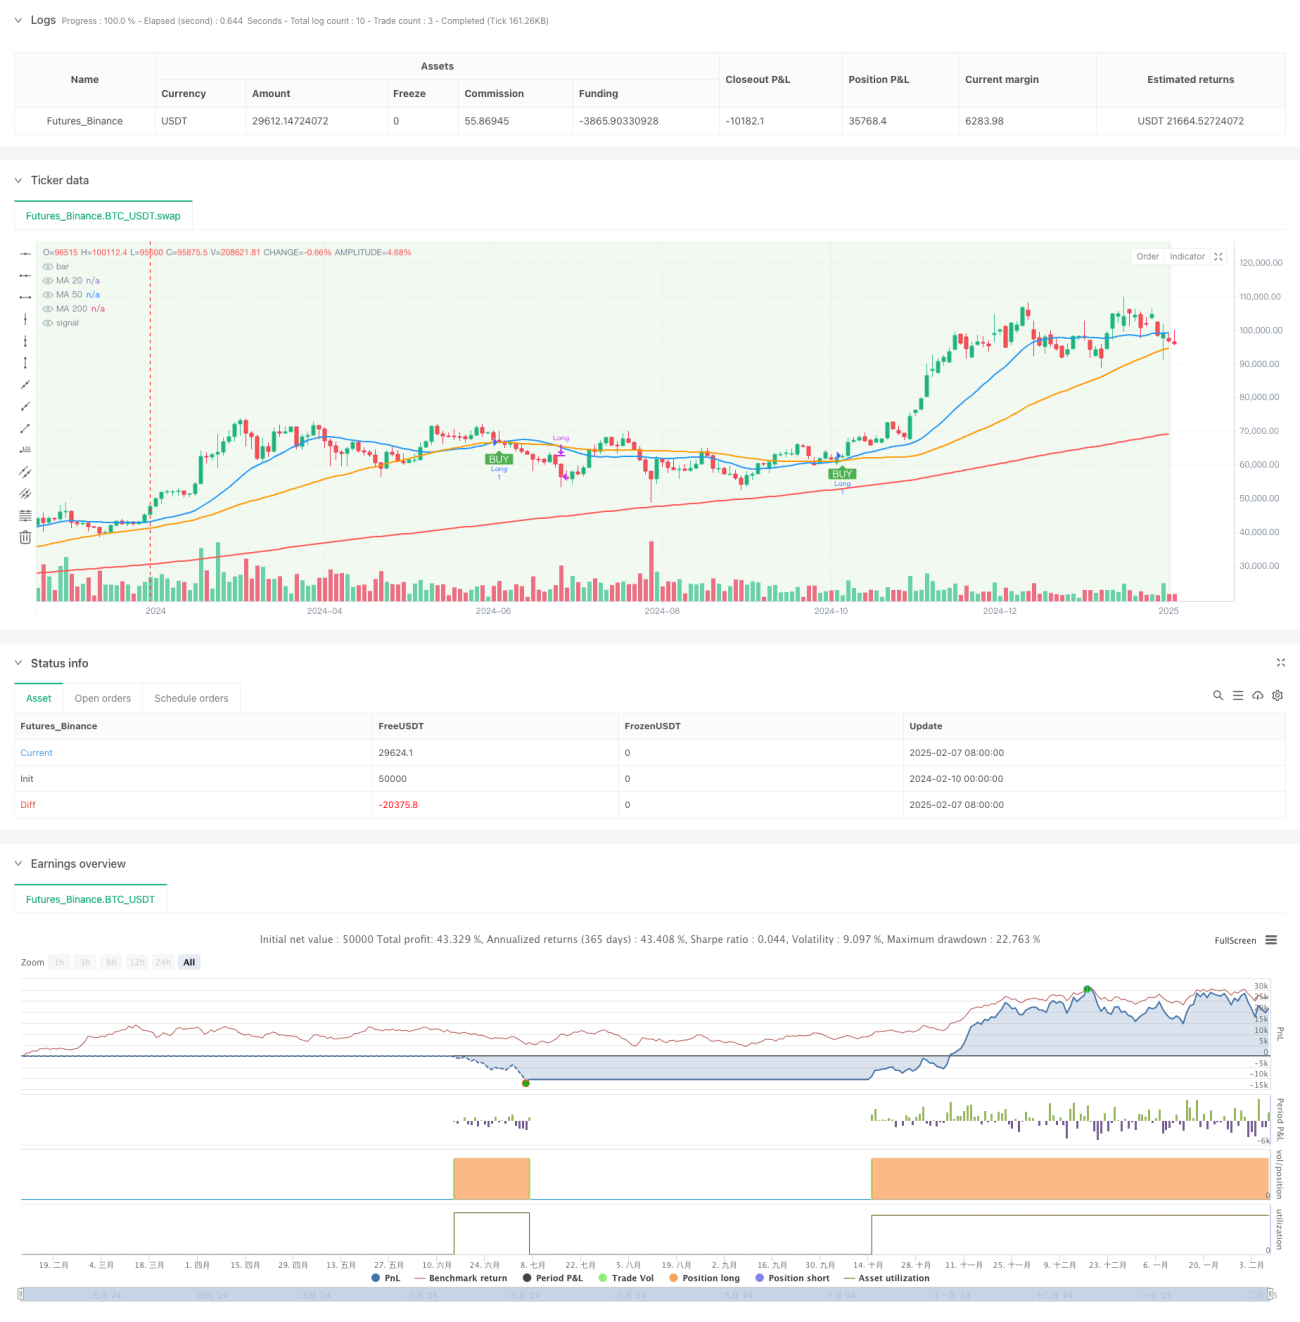
이것은 올리버 발레즈의 거래 방법론에 기반한 삼중평준 트렌드 추적 전략이다. 이 전략은 20주기, 50주기, 200주기 이동 평균의 교차 신호를 사용하여 시장의 추세와 거래 기회를 식별한다. 200주기 평균은 주요 트렌드 필터로 사용되며 20주기, 50주기 평균의 교차는 특정 거래 신호를 생성하는 데 사용됩니다.
전략 원칙
이 전략의 핵심 논리는 세 가지 핵심적인 측면을 포함하고 있습니다.
- 트렌드 식별: 200 주기 평균선을 트렌드 경계선으로 사용한다. 200 평균선 위에 있을 때 상승 트렌드라고 인정하고, 200 평균선 아래에 있을 때 하향 트렌드라고 인정한다.
- 거래 신호: 상승 추세에서 20 주기 평균선이 50 주기 평균선을 상향으로 통과하면 다중 신호를 유발합니다. 하향 추세에서 20 주기 평균선이 50 주기 평균선을 하향으로 통과하면 공백 신호를 유발합니다.
- 위험 제어: 전략은 기본으로 2%의 스톱로즈와 4%의 스톱스<unk>을 설정하고, 반전 크로스 신호가 발생했을 때 자동으로 포지션을 청산한다.
전략적 이점
- 다중확인 메커니즘: 3개의 일률적인 선의 조합을 통해 더 신뢰할 수 있는 거래 신호를 제공합니다.
- 트렌드 필터: 200 일률의 트렌드 필터 기능은 가짜 돌파의 위험을 효과적으로 감소시킵니다.
- 유연성: SMA와 EMA 사이에 전환을 지원하고, 다른 시장 특성에 따라 파라미터를 조정할 수 있다.
- 리스크 관리: 내장된 손해 차단 장치, 자금 안전 보호
- 시각화 효과: 배경 색상의 변화를 통해 트렌드 상태를 직관적으로 표시한다.
전략적 위험
- 지연성: 이동 평균은 본질적으로 지연 지표이며, 출전 또는 출전 시기가 약간 늦어질 수 있다.
- 흔들림 시장은 적용되지 않는다: 가로 디스크 정리 단계에서, 자주 평행선 교차는 거짓 신호를 생성할 수 있다.
- 고정 스톱 리스크: 고정 퍼센티지 스톱 리스를 사용하는 것은 모든 시장 환경에 적합하지 않을 수 있습니다.
- 변수 감수성: 서로 다른 평균주기 설정은 현저하게 다른 결과를 초래할 수 있다.
전략 최적화 방향
- 트래픽 분석을 도입: 트래픽 확인 지표를 추가하여 신호 신뢰성을 향상시킬 수 있다.
- 동적 정지 설정: ATR 또는 변동률 지표를 사용하여 동적으로 정지 위치를 조정하는 것을 고려하십시오.
- 트렌드 강도 필터를 추가: 트렌드 강도 지표인 ADX를 도입하여 약한 트렌드 환경을 필터링할 수 있다.
- 최적화된 입시 시점: 가격 형태와 지지 저항 지점과 결합하여 입시의 정확도를 높인다.
- 시간 필터 추가: 거래 시간 창을 설정하여 변동성이 높은 시간을 피할 수 있습니다.
요약하다
이것은 구조적으로 완전하고 논리적으로 명확한 트렌드 추적 전략이다. 트리플 평행선의 협동적 협동으로 트렌드 식별의 정확성을 보장하고 명확한 거래 신호를 제공합니다. 전략의 위험 관리 메커니즘은 상대적으로 완벽하지만 여전히 최적화 할 여지가 있습니다. 거래자는 실제 사용 전에 충분한 피드백을 수행하고 특정 거래 품종의 특성에 따라 매개 변수 설정을 조정하는 것이 좋습니다.
Source
Pine
Strategy parameters
Related strategies
Comment
All comments (0)
No data
- 1