이중 이동 평균 교차 및 확률적 RSI 매수 과다 및 매도 과다 범위 최적화 거래 전략

1
Follow
1781
Followers
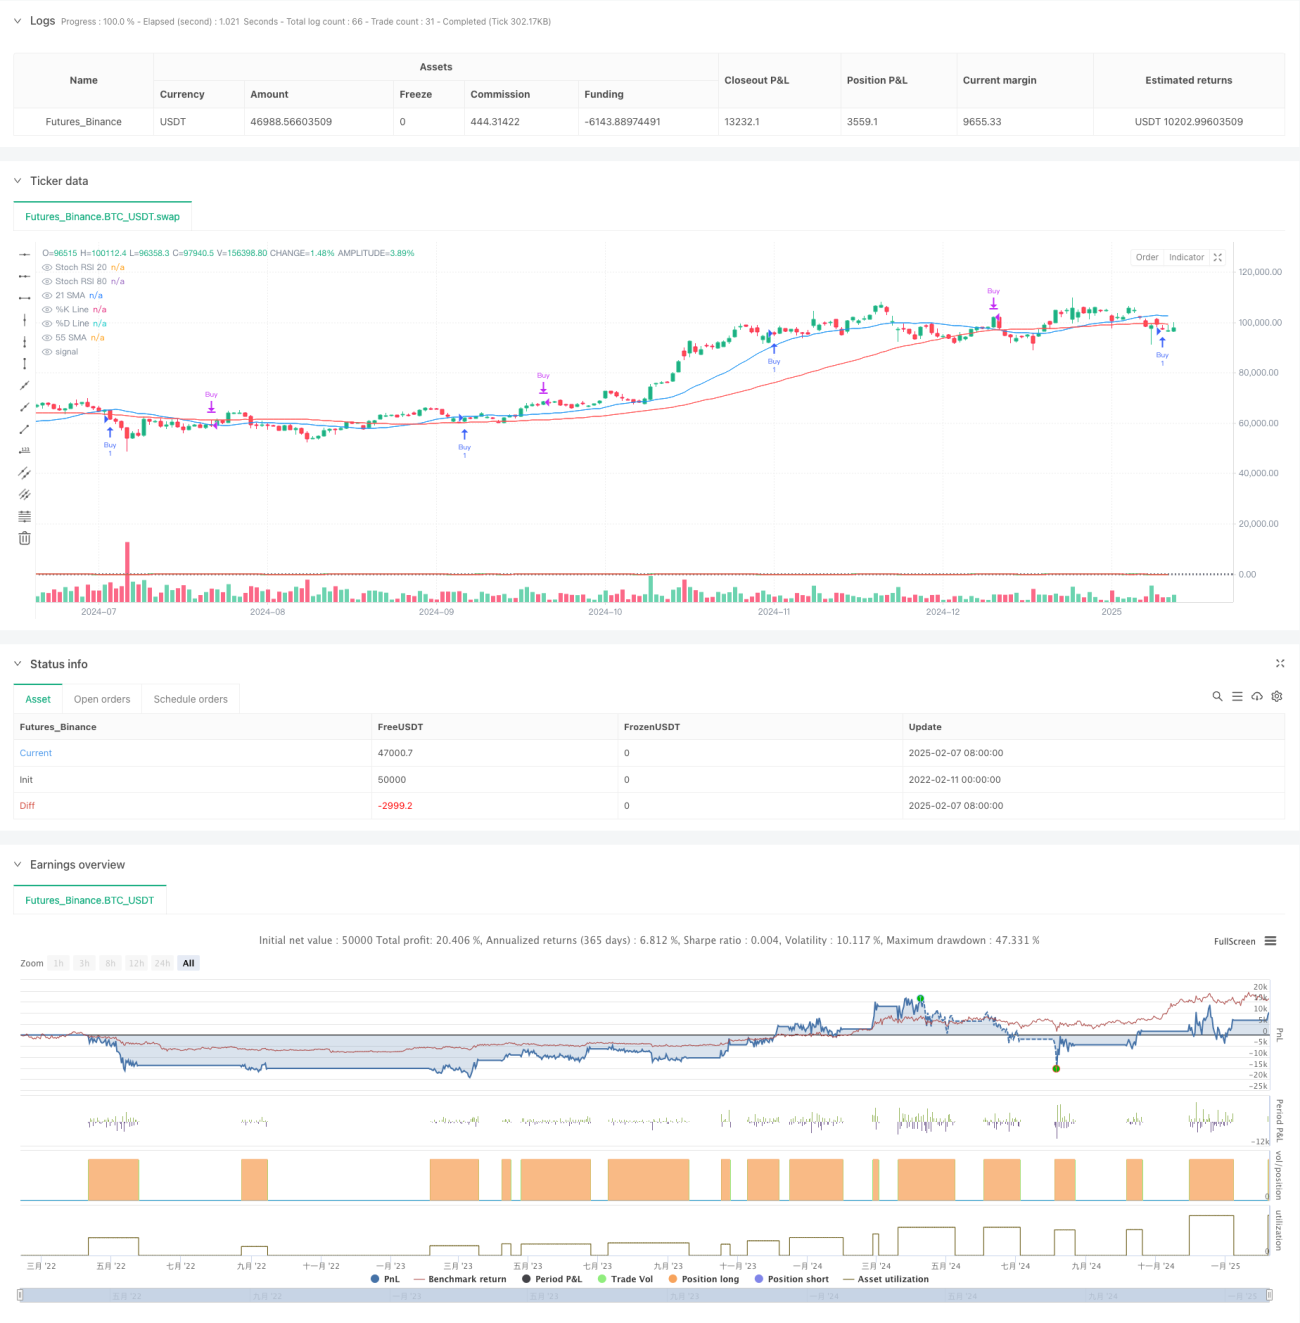
개요
이 전략은 쌍평균선과 무작위 RSI 지표를 결합한 트렌드 추적 거래 시스템이다. 21주기 및 55주기 간단한 이동 평균을 통해 시장의 흐름을 판단하고, 무작위 RSI의 오버 바이 오버 소매 영역을 이용한 최적의 입점과 출구 지점을 찾고, 트렌드 거래에 대한 최적화를 달성한다. 전략은 상승 추세를 확인하는 것을 기반으로, 오버 소매 영역에서 구매 기회를 찾고, 오버 소매 영역에서 판매 기회를 찾는다.
전략 원칙
이 전략은 다음과 같은 핵심 논리를 가지고 있습니다.
- 트렌드 확인: 21주기 SMA와 55주기 SMA를 사용하여, 단기 평균선이 장기 평균선 위에 있을 때 상승세를 확인한다.
- 입시 신호: 트렌드를 확인한 후, 20 이하의 오버셀 영역에서 임의의 RSI의 K 선이 D 선과 골든 크로스를 형성하기 위해 기다립니다.
- 출구 신호: 무작위 RSI의 K 선이 80 이상의 오버 바이 지역과 D 선의 데드 크로스를 형성할 때, 평점 출구.
- 신호 필터링: 트렌드와 동력 지표를 결합하여 가짜 신호를 효과적으로 감소시킵니다.
전략적 이점
- 다중 확인 메커니즘: 트렌드 및 동력의 이중 확인을 통해 거래의 신뢰성을 높인다.
- 리스크 컨트롤 최적화: 오버 바이 오버 셀 영역을 사용하여 트렌드 방향에 따라 더 좋은 입문 지점을 선택하십시오.
- 자기 적응력: 전략의 매개 변수는 시장의 특성에 따라 조정할 수 있다.
- 신호가 명확하다: 입출입 조건이 명확하고 실행하기 쉽다.
- 체계화 수준: 전략 논리가 완전히 체계화되고, 주관적 판단이 줄어들었다.
전략적 위험
- 변동 시장 위험: 변동 시장에서 거래가 자주 발생할 수 있습니다.
- 뒤떨어진 위험: 이동 평균은 뒤떨어진 성격을 가지고 있으며, 최고의 진입 시기를 놓칠 수 있다.
- 가짜 브레이크 위험: 무작위 RSI가 흔들리는 시장에서 가짜 신호를 일으킬 수 있다.
- 매개변수 민감도: 매개변수 조합이 다르면 전략 성과에 큰 차이가 생길 수 있습니다.
전략 최적화 방향
- 변동율 필터를 추가: ATR 지표를 도입하여 낮은 변동율 기간 동안 거래 빈도를 줄인다.
- 출전 메커니즘을 최적화: 이동식 중지 손실 또는 이익 목표를 추가하는 것을 고려할 수 있습니다.
- 시장환경 분류: 다양한 시장환경 동성에 따라 조정 파라미터.
- 거래량 확인이 증가: 거래량 지표가 추가되어 신호의 유효성을 검증한다.
- 트렌드 강도 지표: 약한 트렌드 환경을 필터링하는 데 사용되는 ADX와 같은 것.
요약하다
이 전략은 고전적인 기술 지표와 결합하여 전체적인 트렌드 추적 거래 시스템을 구축한다. 전략은 단순하고 직관적이면서도 여러 신호를 확인함으로써 신뢰성을 높인다. 합리적인 매개 변수 최적화 및 위험 관리로 이 전략은 좋은 실용적 가치를 가지고 있다. 거래자는 실전 사용 전에 충분한 피드백을 수행하고 특정 시장 특성에 따라 매개 변수를 조정하는 것이 좋습니다.
Source
Pine
Strategy parameters
Related strategies
Comment
All comments (0)
No data
- 1