
1
Follow
1781
Followers
개요
이 전략은 다중 기술 지표의 트렌드 추적 시스템을 결합하여 이동 평균 ((EMA), 상대적으로 강한 지표 ((RSI), 이동 평균 동향 분산 지표 ((MACD) 및 브린 밴드 ((BB)) 과 같은 지표를 통합하여 전체 거래 의사 결정 프레임 워크를 구축합니다. 이 전략은 dynamic의 위험 관리 방법을 사용합니다.
전략 원칙
이 전략의 핵심 논리는 다중 차원 시장 분석에 기초하고 있습니다.
- 트렌드 확인: 200일 EMA를 사용하여 장기 트렌드 방향을 결정하고, 빠른 EMA ((20일) 와 느린 EMA ((50일) 의 중간 트렌드 변화를 교차 확인
- 동력 검증: RSI 지표와 MACD를 사용하여 시장 동력을 쌍방향으로 검증하고, RSI가 50 이상 (다중) 또는 50 이하 (공백) 이어야하며, MACD 신호선은 해당 방향을 지원합니다.
- 변동성 제어: 브린 띠를 통해 거래 시기를 정확하게 파악하고, 하단 레일의 지지를 받으며 더 많은 기회를 찾고, 상단 레일의 저항을 받으며 더 적은 기회를 찾습니다.
- 위험 관리: 2%의 중지 손실 설정과 1.5배의 위험 수익률의 중지 레벨을 사용하여 거래 당 위험을 통제 할 수 있도록합니다.
전략적 이점
- 다차원 분석: 트렌드, 동력 및 변동성 지표를 결합하여 가짜 신호의 영향을 줄이십시오.
- 리스크 관리가 완벽합니다: 사전 설정된 스톱 & 스톱 레벨은 거래의 위험을 통제할 수 있도록 합니다.
- 유연성: 다양한 시장 환경에 따라 전략 매개 변수가 조정됩니다.
- 명확한 실행: 입출입 조건이 명확하고, 실행 및 모니터링이 용이하다
- 재원 관리가 합리적입니다: 계좌 지분 비율을 사용하여 포지션 통제를 통해 과도한 위험을 피하십시오.
전략적 위험
- 시장의 변동성 위험: 높은 변동성 기간 동안 빈번한 손실을 유발할 수 있습니다.
- 트렌드 리버스 위험: 트렌드 리버스 포인트에서 큰 회수일 수 있다
- 매개변수 최적화 위험: 과도한 최적화로 인해 과적합이 발생할 수 있습니다.
- 실행 지점 위험: 유동성이 부족할 때 더 큰 지점을 직면할 수 있습니다.
- 수수료 비용 위험: 자주 거래하는 것은 높은 거래 비용을 초래할 수 있습니다.
전략 최적화 방향
- 동적 변수 조정: 시장의 변동에 따라 지표 변수를 자동으로 조정할 수 있습니다.
- 시장 정서 지표를 증가: 거래량과 같은 지표를 도입하여 신호 신뢰성을 향상시킵니다.
- 손해 차단 메커니즘을 최적화: 손해 차단 추적 및 수익 보호 능력을 향상
- 시간 필터를 도입: 거래 시간 창을 추가하는 필터링
- 변동성 필터를 추가: 과도한 변동성 기간에 포지션을 줄이거나 거래를 중지
요약하다
이 전략은 여러 기술 지표를 통합하여 전체적인 트렌드 추적 거래 시스템을 구축한다. 엄격한 위험 관리와 다차원 시장 분석을 통해 전략은 더 나은 적응성과 안정성을 가지고 있다.
Source
Pine
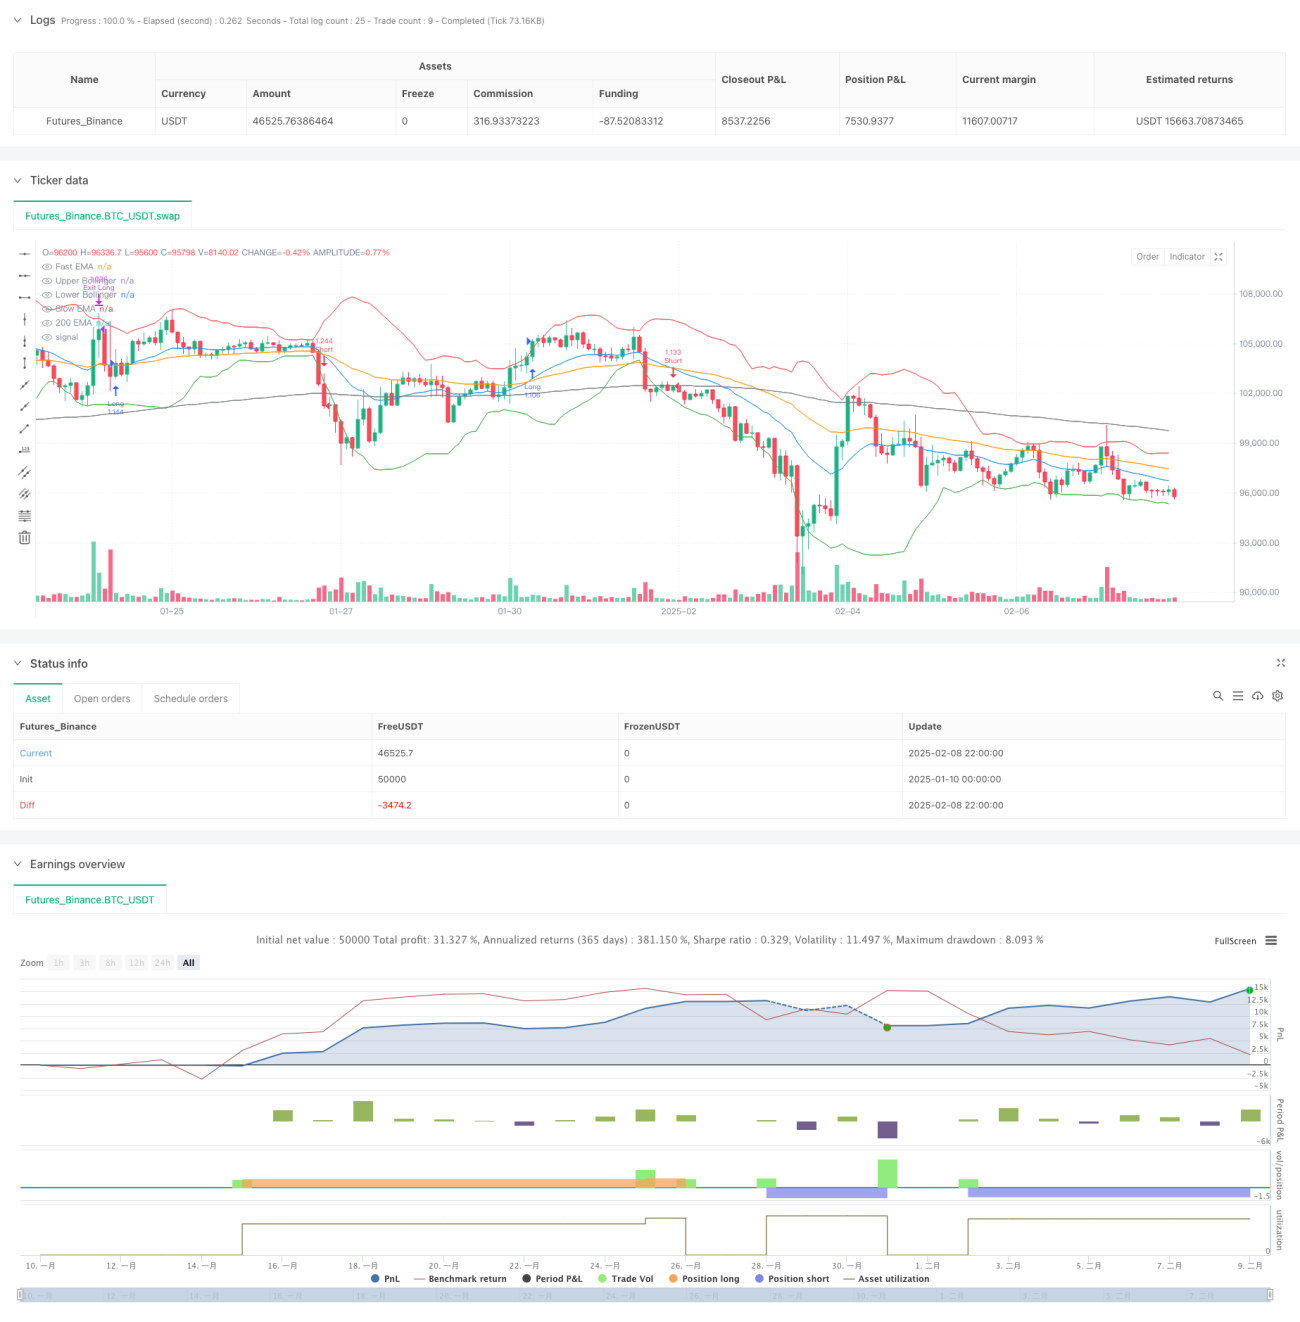
/*backtest
start: 2025-01-10 00:00:00
end: 2025-02-09 00:00:00
period: 2h
basePeriod: 2h
exchanges: [{"eid":"Futures_Binance","currency":"BTC_USDT"}]
*/

//@version=5
strategy("Altcoin Long/Short Strategy", overlay=true, initial_capital=1000, default_qty_type=strategy.percent_of_equity, default_qty_value=200, commission_type=strategy.commission.percent, commission_value=0.1)

// —————— Inputs ——————Strategy parameters
Related strategies
Comment
All comments (0)
No data
- 1