적응형 볼린저 밴드 추세 추종 전략 및 다층 위험 관리 시스템

BB EMA SL TP SMA
생성 날짜: 2025-02-10 15:14:57 마지막으로 수정됨: 2025-02-10 15:14:57
복사: 3 클릭수: 446
avatar of ChaoZhang ChaoZhang
1
집중하다
1617
수행원

적응형 볼린저 밴드 추세 추종 전략 및 다층 위험 관리 시스템

개요

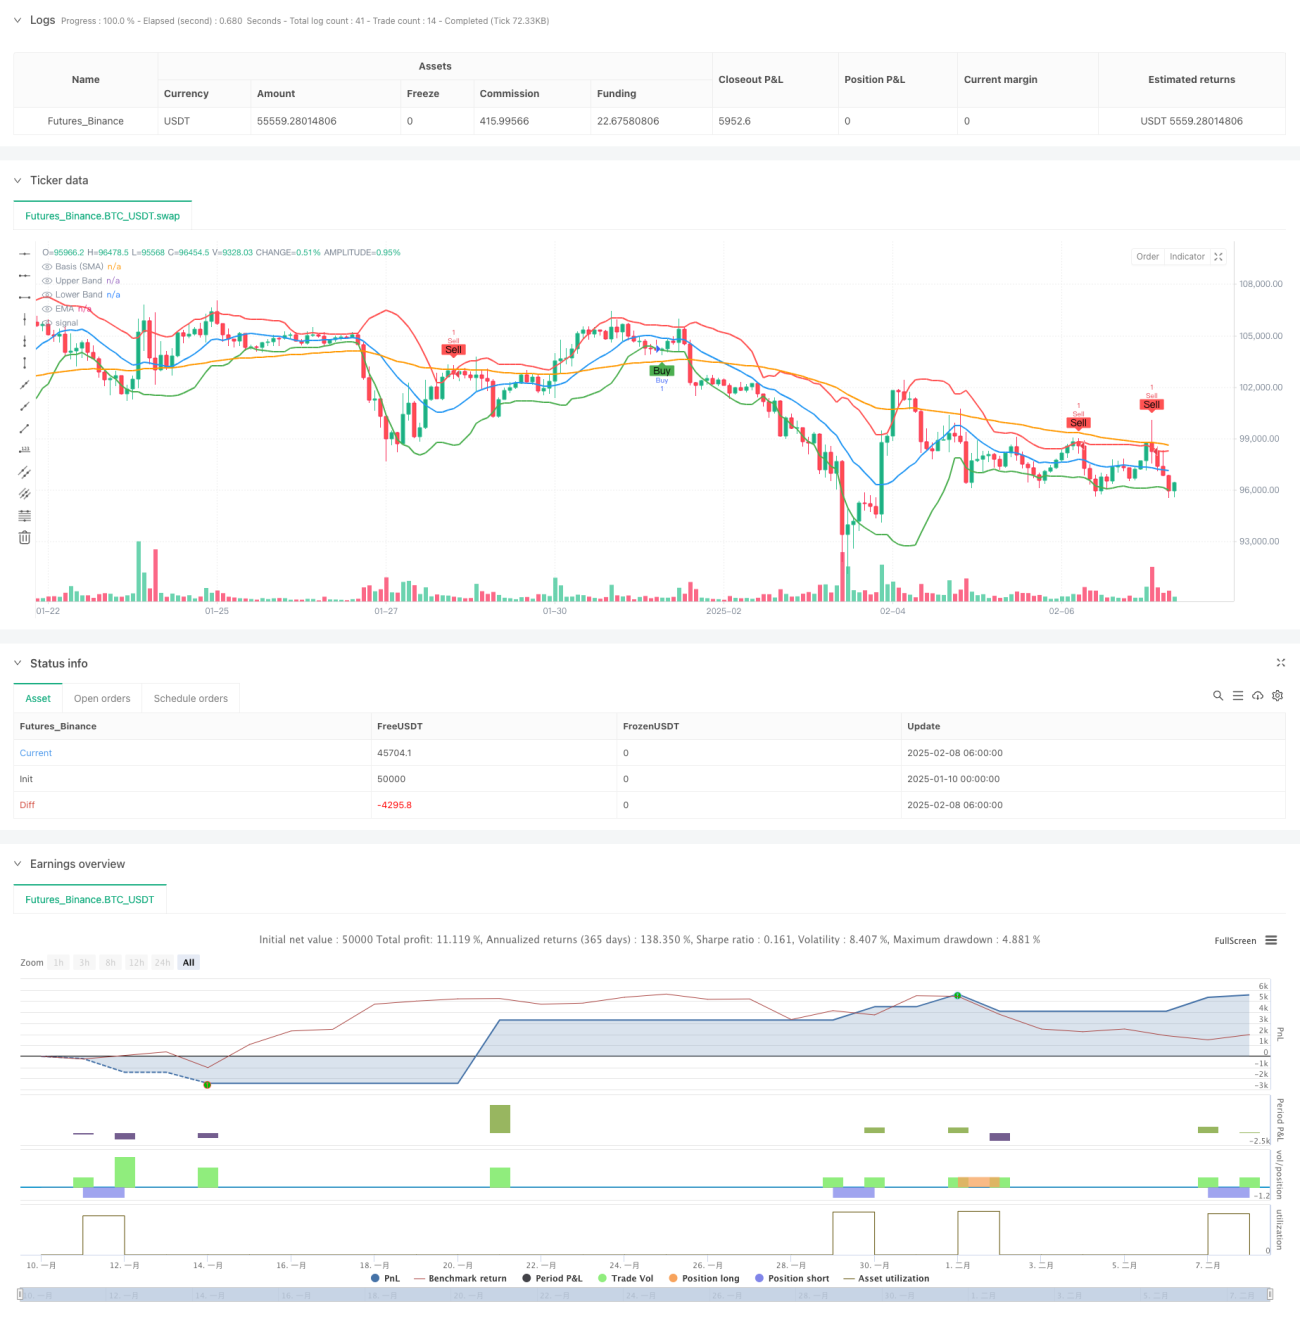
이 전략은 부린 띠와 EMA 지표가 결합된 트렌드 추적 시스템으로, 여러 계층의 위험 제어 메커니즘을 통해 거래 성과를 최적화한다. 전략의 핵심은 부린 띠의 하향 회귀 형태를 이용하여 시장 트렌드를 포착하는 것이며, EMA 트렌드 필터와 결합하여 거래의 정확성을 향상시킨다. 시스템에는 또한 완전한 위험 관리 시스템이 포함되어 있다.

전략 원칙

이 전략의 거래 논리는 다음과 같은 핵심 요소에 기반합니다.

  1. 표준 차등 ((STDDEV) 1.5의, 주기 14의 부린 대역을 주요 거래 신호 지표로 사용
  2. 현재 K선 중 하나의 종착 가격이 경로를 돌파하고 현재 K선이 역전되면 공백 신호가 발생한다
  3. 현재 K선 중 하나의 종전 가격이 하락하고 현재 K선이 강해지면, 다중 신호가 발생
  4. 선택적으로 80주기 EMA를 트렌드 필터로 추가하여 트렌드 방향이 일치하는 경우에만 포지션을 열 수 있습니다.
  5. 가격의 브린 띠 중간 경로를 통과 할 때 트래킹 스톱을 활성화
  6. 고정된 손실 및 수익 목표 금액을 설정할 수 있습니다.
  7. K선 수에 기반한 자동 평정 메커니즘을 지원

전략적 이점

  1. 트렌드 추적 및 반전 거래의 특성을 결합하여 다양한 시장 환경에서 안정적으로 수행 할 수 있습니다.
  2. 다단계 위험 제어 시스템으로 전체적인 자금 관리 프로그램을 제공합니다.
  3. 유연한 매개 변수 설정으로 전략이 다른 시장 조건에 적응할 수 있습니다.
  4. EMA 필터는 가짜 침입의 위험을 효과적으로 줄여줍니다.
  5. 손해를 추적하는 스톱 메커니즘은 수익을 효과적으로 고정시킬 수 있습니다.
  6. 시간적 차원의 평형 메커니즘은 장기간의 교도소의 위험을 피할 수 있습니다.

전략적 위험

  1. 변동성이 큰 시장에서는 빈번하게 잘못된 돌파 신호가 발생할 수 있습니다.
  2. 고정금액의 상쇄 손실은 모든 시장 조건에 적합하지 않을 수 있습니다.
  3. EMA 필터링으로 인해 중요한 거래 기회를 놓칠 수 있습니다.
  4. 파동이 높은 시장에서 조기 평준화될 수 있는 손실을 추적한다
  5. 매개변수 최적화로 인해 과거 데이터의 과적합이 발생할 수 있습니다.

전략 최적화 방향

  1. 시장의 변동에 따라 동적으로 조정되는 적응형 브린 벨트 주기를 도입합니다.
  2. 자금 관리에 기반한 동적 상쇄 시스템 개발
  3. 거래량 분석을 추가하여 돌파구의 유효성을 확인합니다.
  4. 지능을 구현하는 파라미터 최적화 시스템
  5. 시장 환경 인식 모듈을 추가하여 다른 시장 조건에 따라 다른 매개 변수 설정을 사용합니다.

요약하다

이것은 잘 설계된 트렌드 추적 시스템으로, 브린 띠와 EMA의 조합을 통해 신뢰할 수 있는 거래 신호를 제공하며, 여러 계층의 위험 통제를 통해 거래의 안전성을 보장한다. 전략의 구성성이 강하여 다양한 거래 스타일과 시장 환경에 적응할 수 있다. 일부 고유한 위험이 존재하지만, 제안된 최적화 방향은 전략의 안정성과 수익성을 더욱 향상시킬 수 있다.

전략 소스 코드
/*backtest
start: 2025-01-10 00:00:00
end: 2025-02-08 08:00:00
period: 2h
basePeriod: 2h
exchanges: [{"eid":"Futures_Binance","currency":"BTC_USDT"}]
*/

//@version=5
strategy("AI Bollinger Bands Strategy with SL, TP, and Bars Till Close", overlay=true)

// Input parameters
bb_length           = input.int(14, title="Bollinger Bands Length", minval=1)
bb_stddev           = input.float(1.5, title="Bollinger Bands Standard Deviation", minval=0.1)
use_ema             = input.bool(true, title="Use EMA Filter")
ema_length          = input.int(80, title="EMA Length", minval=1)
use_trailing_stop   = input.bool(true, title="Use Trailing Stop")
use_sl              = input.bool(true, title="Use Stop Loss")
use_tp              = input.bool(false, title="Use Take Profit")
sl_dollars          = input.float(300.0, title="Stop Loss (\$)", minval=0.0)
tp_dollars          = input.float(1000.0, title="Take Profit (\$)", minval=0.0)
use_bars_till_close = input.bool(true, title="Use Bars Till Close")
bars_till_close     = input.int(10, title="Bars Till Close", minval=1)
// New input to toggle indicator plotting
plot_indicators     = input.bool(true, title="Plot Bollinger Bands and EMA on Chart")

// Calculate Bollinger Bands and EMA
basis      = ta.sma(close, bb_length)
upper_band = basis + bb_stddev * ta.stdev(close, bb_length)
lower_band = basis - bb_stddev * ta.stdev(close, bb_length)
ema        = ta.ema(close, ema_length)

// Plot Bollinger Bands and EMA conditionally
plot(plot_indicators  ? basis : na, color=color.blue, linewidth=2, title="Basis (SMA)")
plot(plot_indicators ? upper_band : na, color=color.red, linewidth=2, title="Upper Band")
plot(plot_indicators  ? lower_band : na, color=color.green, linewidth=2, title="Lower Band")
plot(plot_indicators   ? ema   : na, color=color.orange, linewidth=2, title="EMA")

// EMA conditions
ema_long_condition  = ema > ema[1]
ema_short_condition = ema < ema[1]

// Entry conditions
sell_condition = close[1] > upper_band[1] and close[1] > open[1] and close < open
if sell_condition and (not use_ema or ema_short_condition)
    strategy.entry("Sell", strategy.short)

buy_condition = close[1] < lower_band[1] and close > open
if buy_condition and (not use_ema or ema_long_condition)
    strategy.entry("Buy", strategy.long)

// Trailing stop logic
if use_trailing_stop
    if strategy.position_size > 0 and close >= basis
        strategy.exit("Trailing Stop Long", from_entry="Buy", stop=low)
    if strategy.position_size < 0 and close <= basis
        strategy.exit("Trailing Stop Short", from_entry="Sell", stop=high)

// Stop Loss and Take Profit logic
if use_sl or use_tp
    if strategy.position_size > 0
        long_entry = strategy.position_avg_price
        long_sl    = long_entry - sl_dollars
        long_tp    = long_entry + tp_dollars
        if use_sl and close <= long_sl
            strategy.close("Buy", comment="Long SL Hit")
        if use_tp and close >= long_tp
            strategy.close("Buy", comment="Long TP Hit")
    if strategy.position_size < 0
        short_entry = strategy.position_avg_price
        short_sl    = short_entry + sl_dollars
        short_tp    = short_entry - tp_dollars
        if use_sl and close >= short_sl
            strategy.close("Sell", comment="Short SL Hit")
        if use_tp and close <= short_tp
            strategy.close("Sell", comment="Short TP Hit")

// Bars Till Close logic
var int bars_since_entry = na
if strategy.position_size != 0
    bars_since_entry := na(bars_since_entry) ? 0 : bars_since_entry + 1
else
    bars_since_entry := na

if use_bars_till_close and not na(bars_since_entry) and bars_since_entry >= bars_till_close
    strategy.close("Buy", comment="Bars Till Close Hit")
    strategy.close("Sell", comment="Bars Till Close Hit")

// Plot buy/sell signals
plotshape(sell_condition and (not use_ema or ema_short_condition), title="Sell Signal", location=location.abovebar, color=color.red, style=shape.labeldown, text="Sell")
plotshape(buy_condition and (not use_ema or ema_long_condition), title="Buy Signal", location=location.belowbar, color=color.green, style=shape.labelup, text="Buy")