
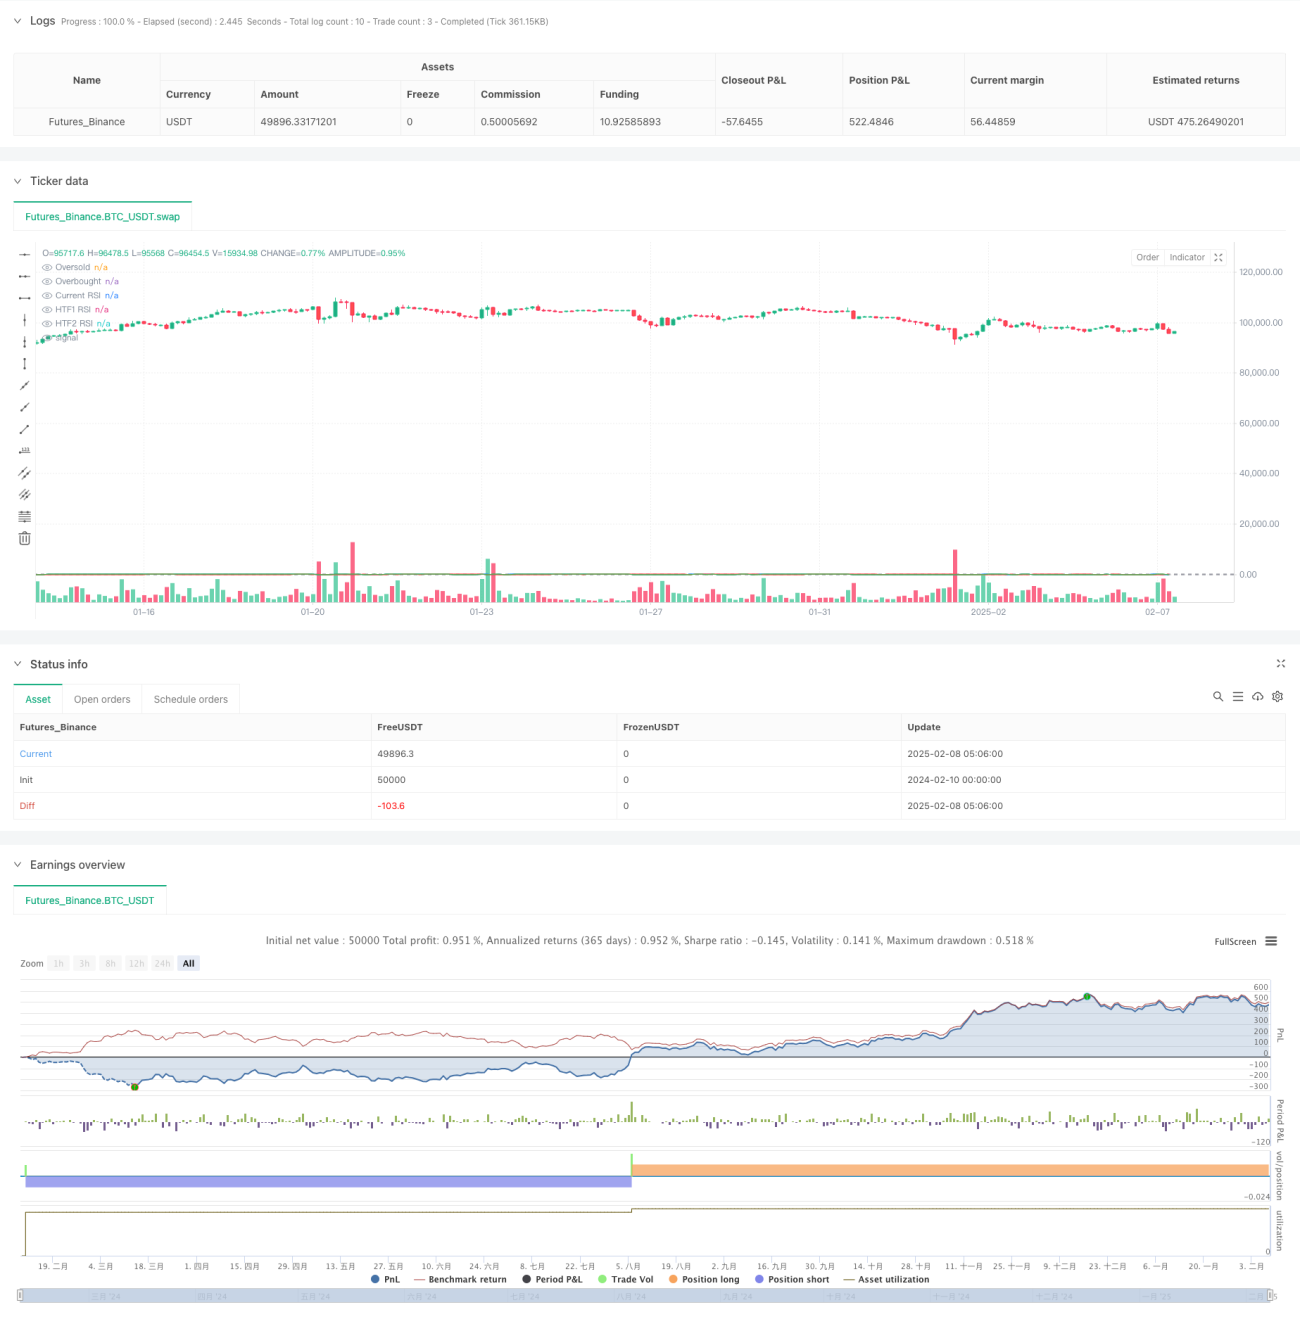
이 전략은 다중 시간 주기의 RSI 지표와 동적 격자 거래 시스템을 결합한 복합 전략이다. 이 전략은 3개의 다른 시간 주기의 RSI 지표 값을 분석하여 시장의 과매매 상태를 식별하고, ATR 기반의 동적 격자 시스템을 사용하여 포지션 관리를 한다. 이 전략은 또한 매일 막대기, 최대 철회 보호와 같은 위험 제어 장치를 포함하며, 수익과 위험을 효과적으로 균형을 잡는다.
전략의 핵심 논리는 다음과 같은 핵심 부분으로 구성됩니다.
이 전략은 다중 시간 주기의 RSI 분석과 동적 격자 거래 시스템을 결합하여 균형 잡힌 거래 프로그램을 만듭니다. 정교한 위험 제어 장치와 유연한 매개 변수 설정은 다양한 시장 환경에 적합합니다. 제안된 최적화 방향을 통해 전략의 안정성과 수익성을 더욱 향상시킬 수 있습니다.
/*backtest
start: 2024-02-10 00:00:00
end: 2025-02-08 08:00:00
period: 3h
basePeriod: 3h
exchanges: [{"eid":"Futures_Binance","currency":"BTC_USDT"}]
*/
//@version=5
strategy("Multi-Timeframe RSI Grid Strategy with Arrows", overlay=true)
// Input parameters
rsi_length = input.int(14, "RSI Length")
oversold = input.int(30, "Oversold Level")
overbought = input.int(70, "Overbought Level")
higher_tf1 = input.string("60", "Higher Timeframe 1")
higher_tf2 = input.string("240", "Higher Timeframe 2")
grid_factor = input.float(1.2, "Grid Multiplication Factor", step=0.1)
lot_multiplier = input.float(1.5, "Lot Multiplication Factor", step=0.1)
max_grid = input.int(5, "Maximum Grid Levels")
daily_target = input.float(4.0, "Daily Profit Target (%)", step=0.5)
atr_length = input.int(14, "ATR Length")
// Calculate RSI values
current_rsi = ta.rsi(close, rsi_length)
higher_tf1_rsi = request.security(syminfo.tickerid, higher_tf1, ta.rsi(close, rsi_length))
higher_tf2_rsi = request.security(syminfo.tickerid, higher_tf2, ta.rsi(close, rsi_length))
// Grid system variables
var int grid_level = 0
var float last_entry_price = na
var float base_size = strategy.equity * 0.01 / close
var float daily_profit_target = strategy.equity * (daily_target / 100)
var bool target_reached = false
// ATR for grid spacing
atr = ta.atr(atr_length)
grid_space = atr * grid_factor
// Daily reset
new_day = ta.change(time("D"))
if new_day
daily_profit_target := strategy.equity * (daily_target / 100)
target_reached := false
grid_level := 0
last_entry_price := na
// Trading conditions
buy_condition = current_rsi < oversold and higher_tf1_rsi < oversold and higher_tf2_rsi < oversold
sell_condition = current_rsi > overbought and higher_tf1_rsi > overbought and higher_tf2_rsi > overbought
// Reverse signal detection
reverse_long_to_short = sell_condition and strategy.position_size > 0
reverse_short_to_long = buy_condition and strategy.position_size < 0
// Close all trades on reverse signals
if reverse_long_to_short or reverse_short_to_long
strategy.close_all()
grid_level := 0
last_entry_price := na
// Grid management logic
if strategy.position_size == 0
grid_level := 0
last_entry_price := na
if strategy.position_size > 0 and not reverse_long_to_short
if close < last_entry_price - grid_space and grid_level < max_grid and not target_reached
strategy.entry("Long Grid " + str.tostring(grid_level), strategy.long, qty=base_size * math.pow(lot_multiplier, grid_level))
grid_level += 1
last_entry_price := close
if strategy.position_size < 0 and not reverse_short_to_long
if close > last_entry_price + grid_space and grid_level < max_grid and not target_reached
strategy.entry("Short Grid " + str.tostring(grid_level), strategy.short, qty=base_size * math.pow(lot_multiplier, grid_level))
grid_level += 1
last_entry_price := close
// Initial entry
if buy_condition and strategy.position_size == 0 and not target_reached
strategy.entry("Long", strategy.long, qty=base_size)
grid_level := 1
last_entry_price := close
if sell_condition and strategy.position_size == 0 and not target_reached
strategy.entry("Short", strategy.short, qty=base_size)
grid_level := 1
last_entry_price := close
// Profit target check
current_profit = strategy.netprofit + strategy.openprofit
if current_profit >= daily_profit_target and not target_reached
strategy.close_all()
target_reached := true
// Drawdown protection
if strategy.openprofit < -(0.02 * strategy.equity) // 2% drawdown protection
strategy.close_all()
grid_level := 0
last_entry_price := na
// Plot Buy and Sell Arrows
plotshape(series=buy_condition and strategy.position_size == 0, title="Buy Signal", location=location.belowbar, color=color.green, style=shape.labelup, text="BUY", size=size.small)
plotshape(series=sell_condition and strategy.position_size == 0, title="Sell Signal", location=location.abovebar, color=color.red, style=shape.labeldown, text="SELL", size=size.small)
// Plotting RSI
plot(current_rsi, "Current RSI", color=color.blue)
plot(higher_tf1_rsi, "HTF1 RSI", color=color.red)
plot(higher_tf2_rsi, "HTF2 RSI", color=color.green)
hline(oversold, "Oversold", color=color.gray)
hline(overbought, "Overbought", color=color.gray)